Businesses that want to be competitive in today’s digital landscape are always on a lookout for ways to augment their Sales, Service and Marketing initiatives. To make an impact, it is necessary for a business to analyze and understand their customer’s needs and reach out to them with relevant information that appeals to them on a personal level.
Having all of their data in Dynamics 365 is a step in the right direction to achieve this goal. However, understanding and interpreting the data in a way that allows for greater visibility of their customers and prospects, requires a tool that can not only extract the locational aspect of Dynamics 365 data but also allow users to plot them on the map, perform drill-down analysis, manage sales territories, create targeted marketing campaigns, plan appointments, create routes and more.
Maplytics™ has allowed businesses to leverage the power of geospatial intelligence and being a Certified for Microsoft Dynamics 365 app, is an obvious choice for organizations around the world.
In this blog series, we will explore how Sales and Marketing Teams can utilize the features and functionalities of Maplytics to get the most value out of their Dynamics 365 data.
To start with, let us understand how a Sales Manager can gain more visibility, perform drill-down analysis and improve team collaboration with Maplytics.
Maplytics Workflow for a Sales Manager:
For a Sales Manager, it is crucial to be on the top of the sales activities in the organization. By knowing the appointments the team has for the day, open opportunities, open cases and sales statistics, the Sales Manager can make data-driven decisions that have the maximum impact.
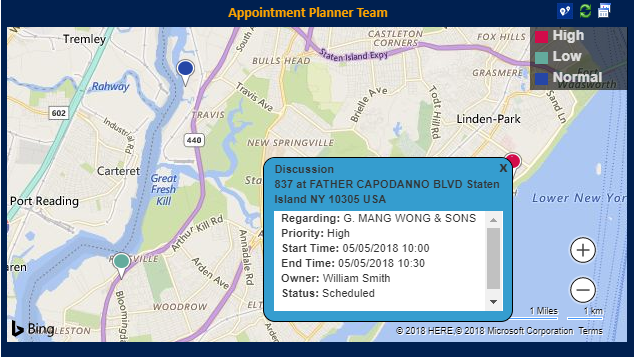
The Sales Manager can have all this information and more by creating Maplytics Dashboards for the things that matter the most.
At a glance Sales Information with Maplytics Dashboards
Now, creating Maplytics Dashboards is very easy and the steps for it can be found here. The user can create various dashboards based on their business needs.
For this blog, we have already created a ‘Maplytics Overview – Sales Manager’ dashboard.
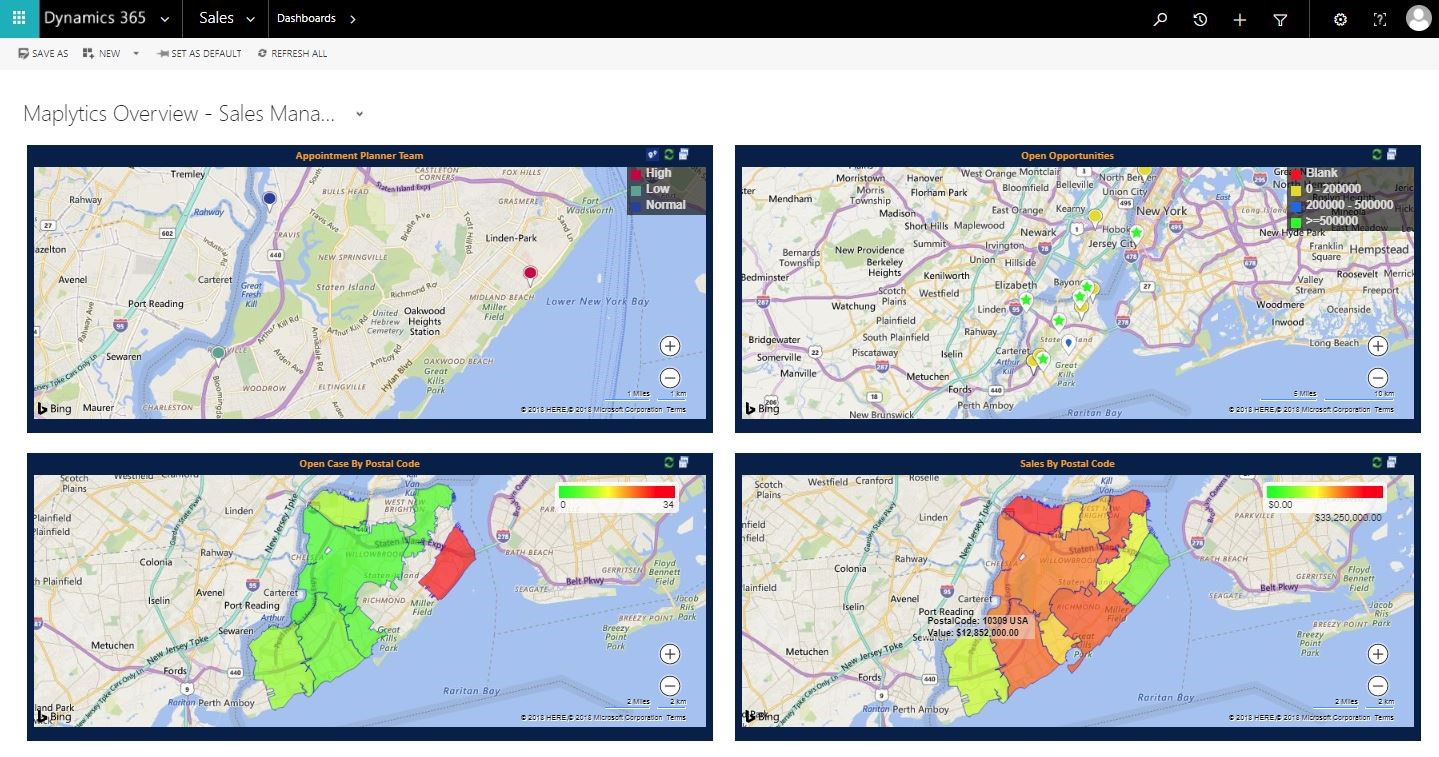
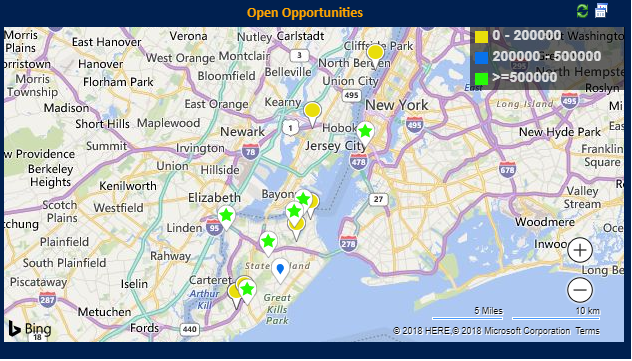
The second dashboard, ‘Open Opportunities’, will provide the Sales Manager a view of all the open opportunities further color coded based on Estimated Revenue.
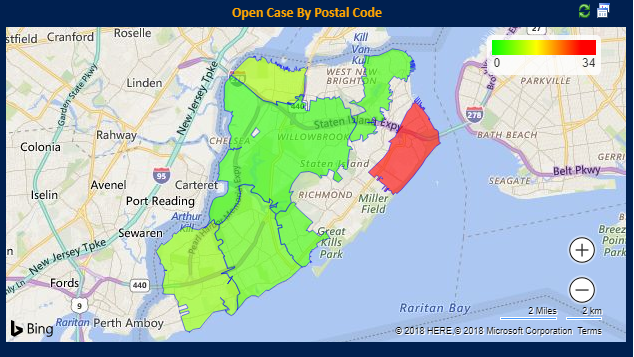
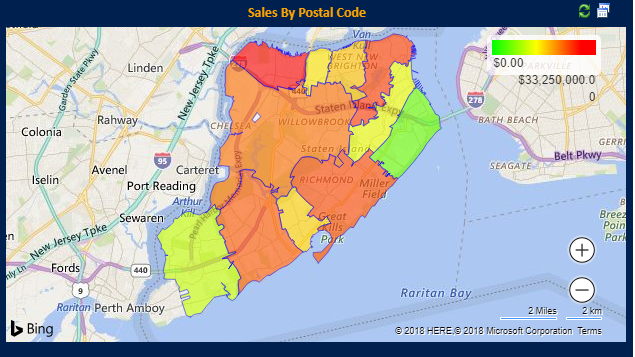
Just by having a glance at the ‘Open Case by Postal Code’, the sales manager can identify the regions that have a high number of open cases and inform the service reps to close them as soon as possible.
 Drill-down Analysis with Maplytics Detail Map
Now that the Sales Manager has an overview of the sales statistics, next step is to drill down into the Dynamics 365 data on the map.
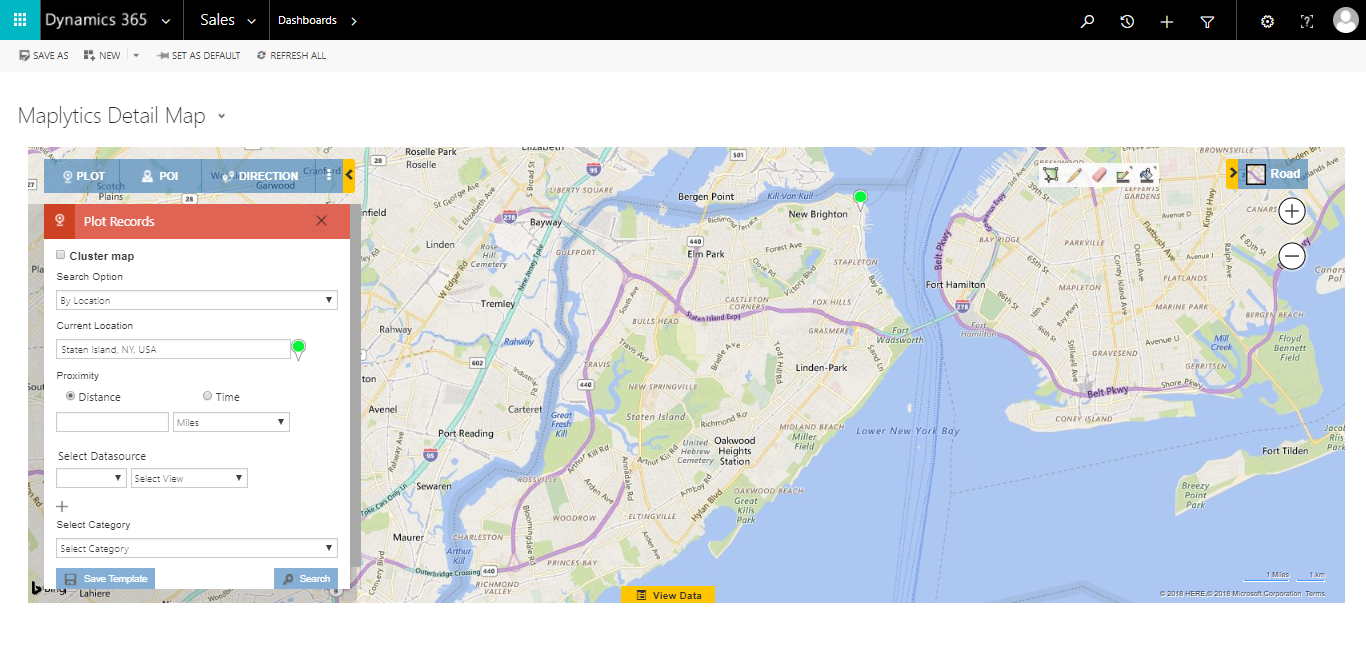
Maplytics Detail Map is the place where the Sales Manager can not only visualize the Dynamics 365 data on the map but also further drill-down into the data and perform a plethora of actions to get the most out of their Dynamics CRM data.
Detail Map can be accessed either from the Maplytics Detail Map dashboard.

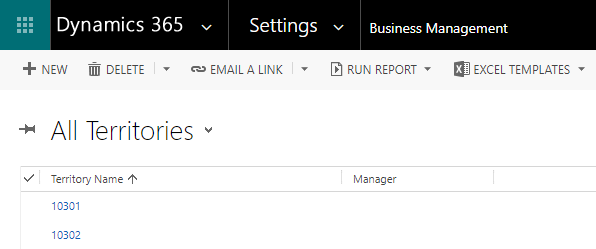
Maplytics further extends the Sales Territories functionality by providing the user the ability to define Geographies (geographical regions) for the sales territories.
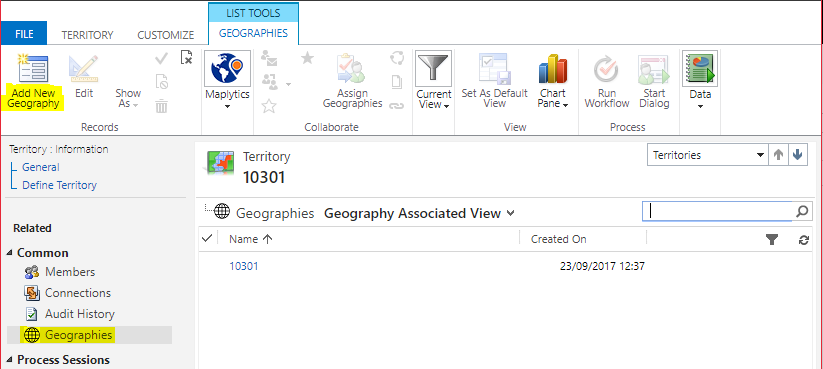
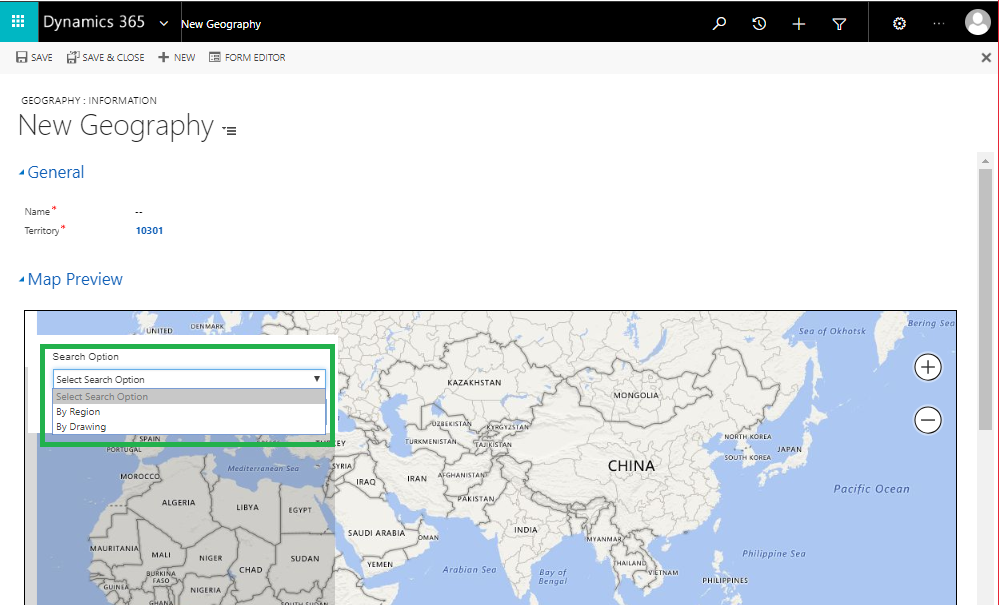
To learn more about Territory Management in Maplytics, refer the below articles;
-
Define Geographic Regions for Sales Territory in Dynamics CRM
-
-
-
Quickly Setup new Sales Territories in Dynamics 365 CRM using Bulk Geographies Feature
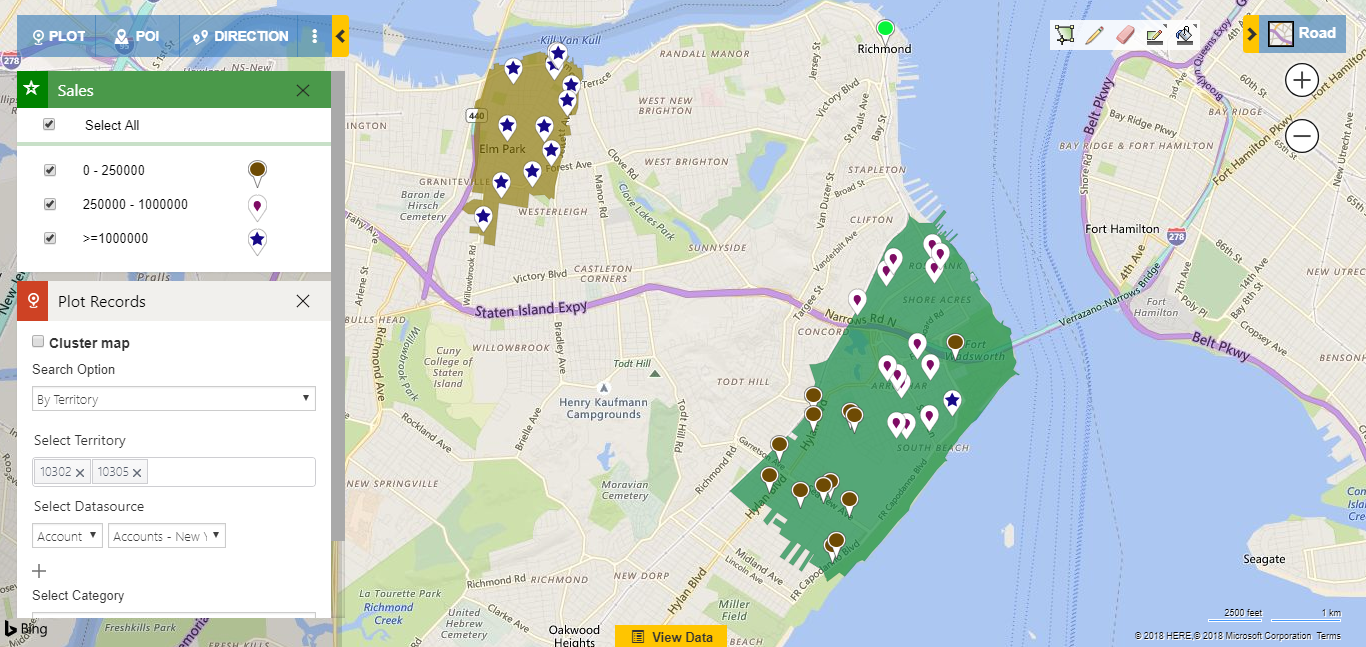
After defining the Geographies for the Territories, the Sales Manager can plot the Sales Territories on the map in Dynamics 365 and perform drill-down analysis of the data.
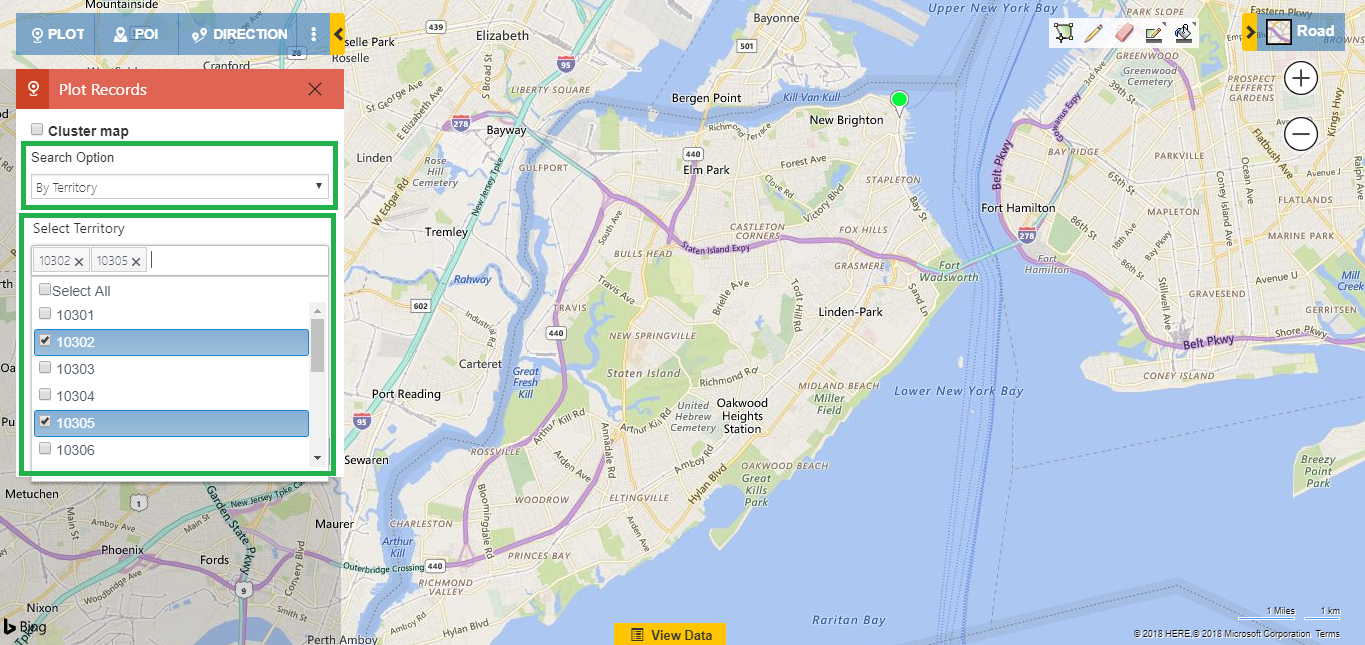
For this, the Sales Manager can open the Detail Map and use the ‘By Territory’ option to plot the relevant sales territories for analysis. For this blog, we have created Sales Territories based on Postal/Zip Codes.
In this case, we are selecting ‘Sales’ category to further filter the data based on Sales in the selected Sales Territories.
Note: To configure the color for different categories, please refer this article.
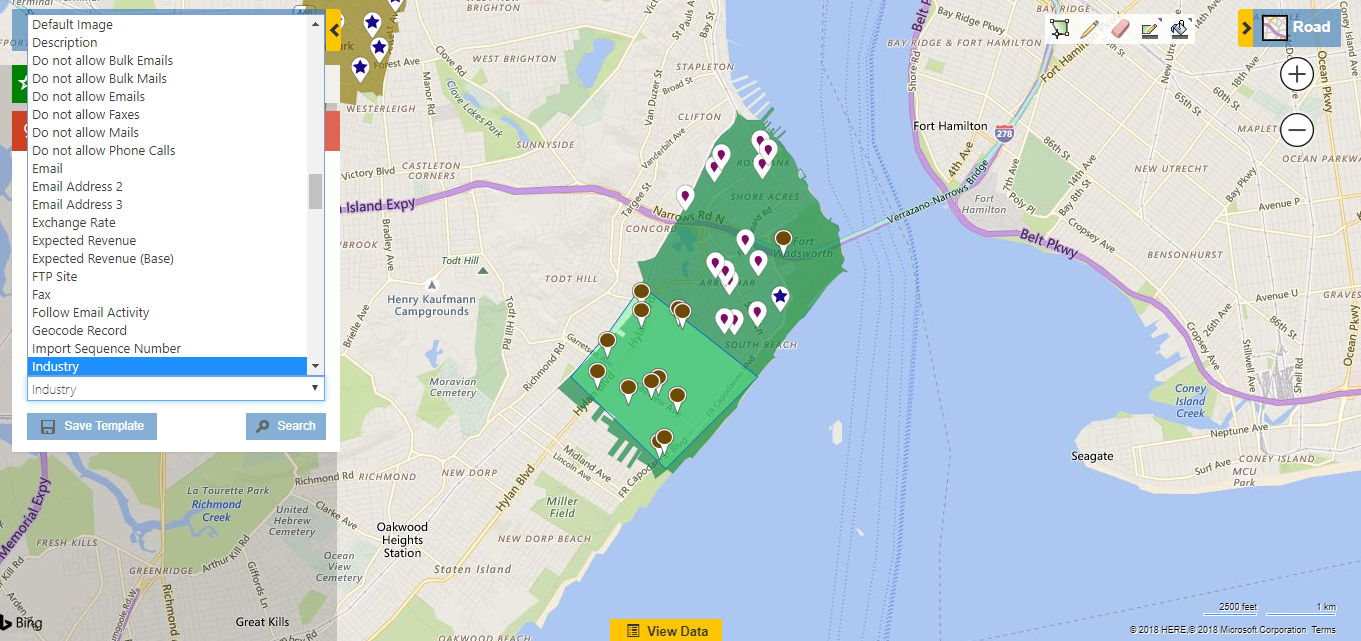
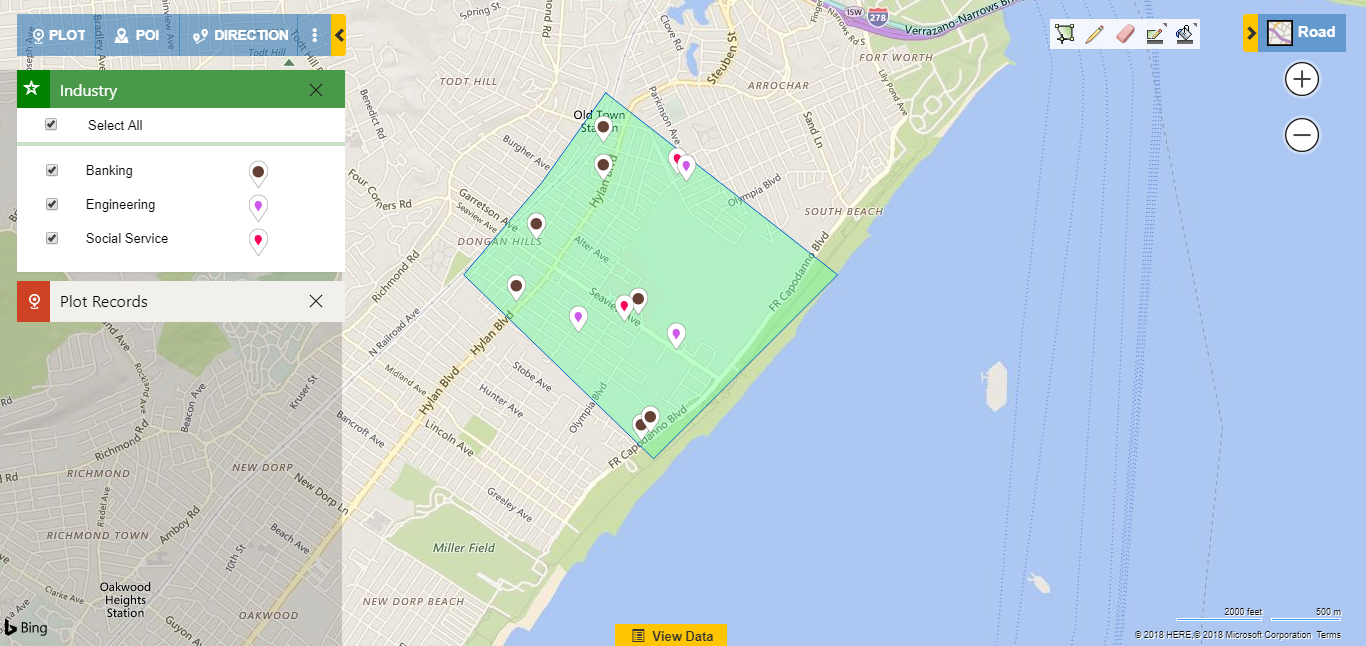
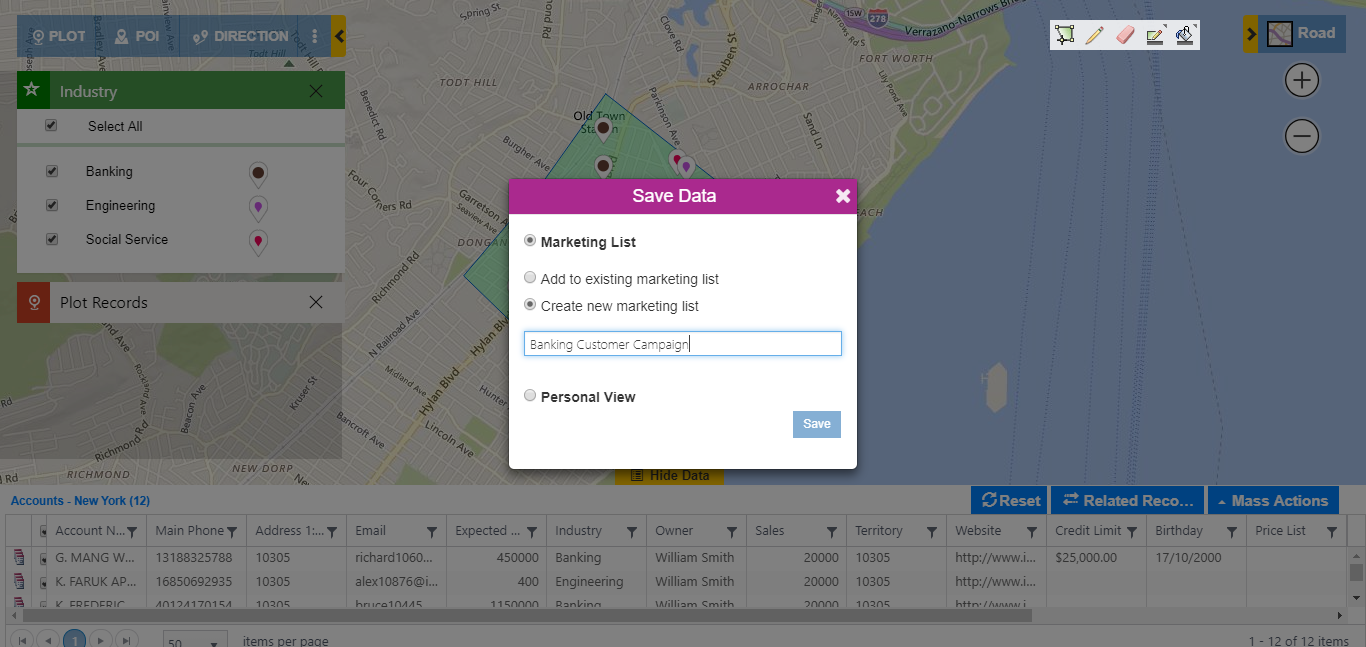
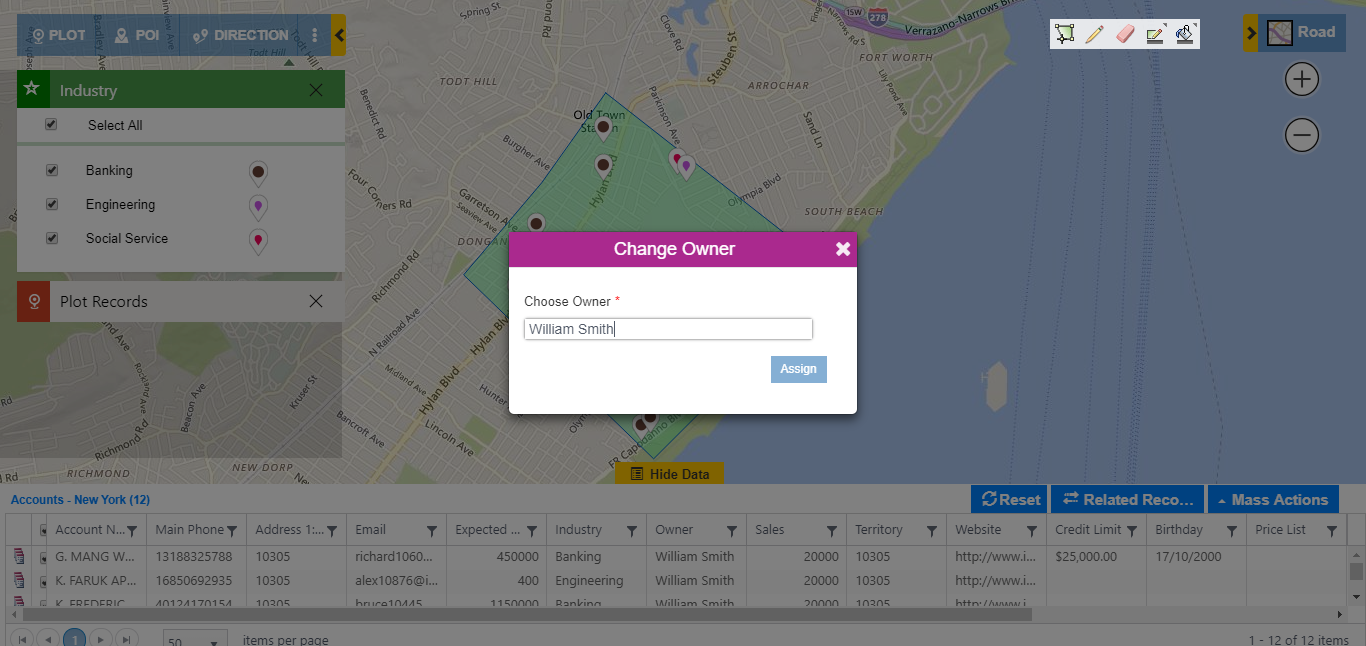
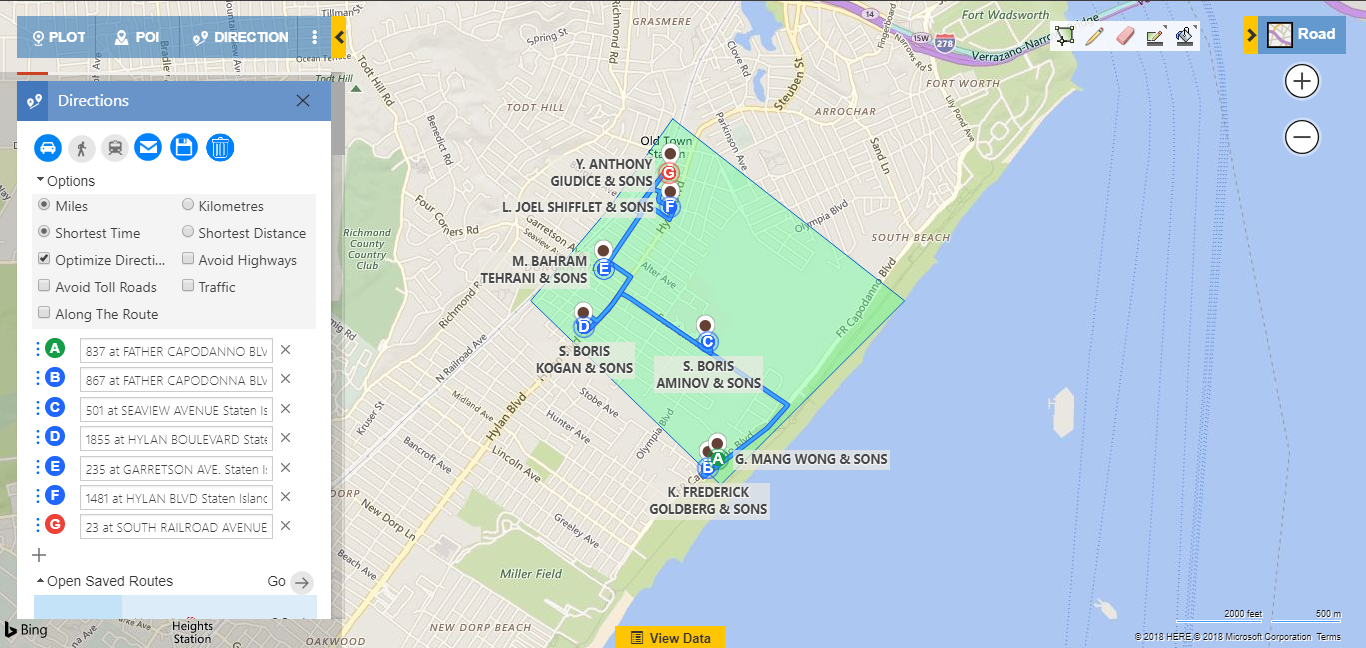
Just by looking at the map visualization of the Dynamics CRM data further filtered based on Sales attribute, the Sales Manager can identify the Accounts with low Sales and further use the ‘By Drawing’ option to isolate those records and further filter them based on Industry attribute to for drill-down analysis.
In the next blogs, we will discuss how the Sales Rep and the Marketing Manager can take this further using Maplytics within Dynamics CRM.
Maplytics is a leading geo-analytical app for Dynamics 365 and is one of the first mapping solutions to be Certified for Microsoft Dynamics 365 (CfMD). Maplytics provides powerful map visualization and routing capabilities within Dynamics 365 to provide insightful location-based business insights. By using the powerful feature of Maplytics like Appointment Planner, Route Optimization, Proximity Search based on Distance and Time, Concentric Proximity Search based on Distance, Along the Route Search, Analytical Dashboards, and Territory Mapping & Management, an organization can drive better sales, improve business processes and engage right customers at the right time.
Get your free TRIAL today from our Website or Microsoft AppSource!
Happy Mapping!

 Drill-down Analysis with Maplytics Detail Map