A couple of weeks ago, we were approached by one of our loyal clients from the construction industry with a very peculiar request. They were highly competitive and on an expansion spree. The brand was targeting new, big construction sites and strategizing against established competition. They were able to visualize their competitors on the map as pushpins using Maplytics but they wanted to have this plotting as a customized view for instant viewing when required!
Confused? Let’s understand the requirements properly.
Client Request
Our client organization was aiming to target a new construction site and was about to file their quotation. They wanted to outperform 3 competitors. The competitors were visible to them on the map and so was the new construction site. They wanted to generate a view where they could visualize themselves and the competitors together on the map. This would also display the vitals of the client and the competitors such as distance and travel time. With this view optimized, with every new targeted site plotted on the map, they would easily be able to analyze their distance from the new site, competitors’ distance from it, and subsequent travel time.
Now you would ask, how does that information help?
So, if the new site was
| 5 km from Competitor A
4 km from Competitor B 6 km from Competitor C and 12 km from our Client |
Our client would quote a lesser cost as compared to the competitors claiming that, since the travel distance and time were more, their delivery would be delayed, however, they would compensate the gap with competitive costs and additional discounts!
On the other hand, if the new site was
| 15 km from Competitor A
24 km from Competitor B 26 km from Competitor C and 5 km from our Client |
Our Client would quote more cost as compared to the competitors claiming that they are the closest, they would provide fast delivery with optimized routes and thus, charge premium for the premium services!
Smart move right?
But then to be at the top of the game, they needed hands-on plotting every time where they would be able to plot the competitors and themselves with the changing sites.
Solution
So, were we able to help them? Yes!
Team Maplytics developed the feature of ‘Related Records’
Related Records
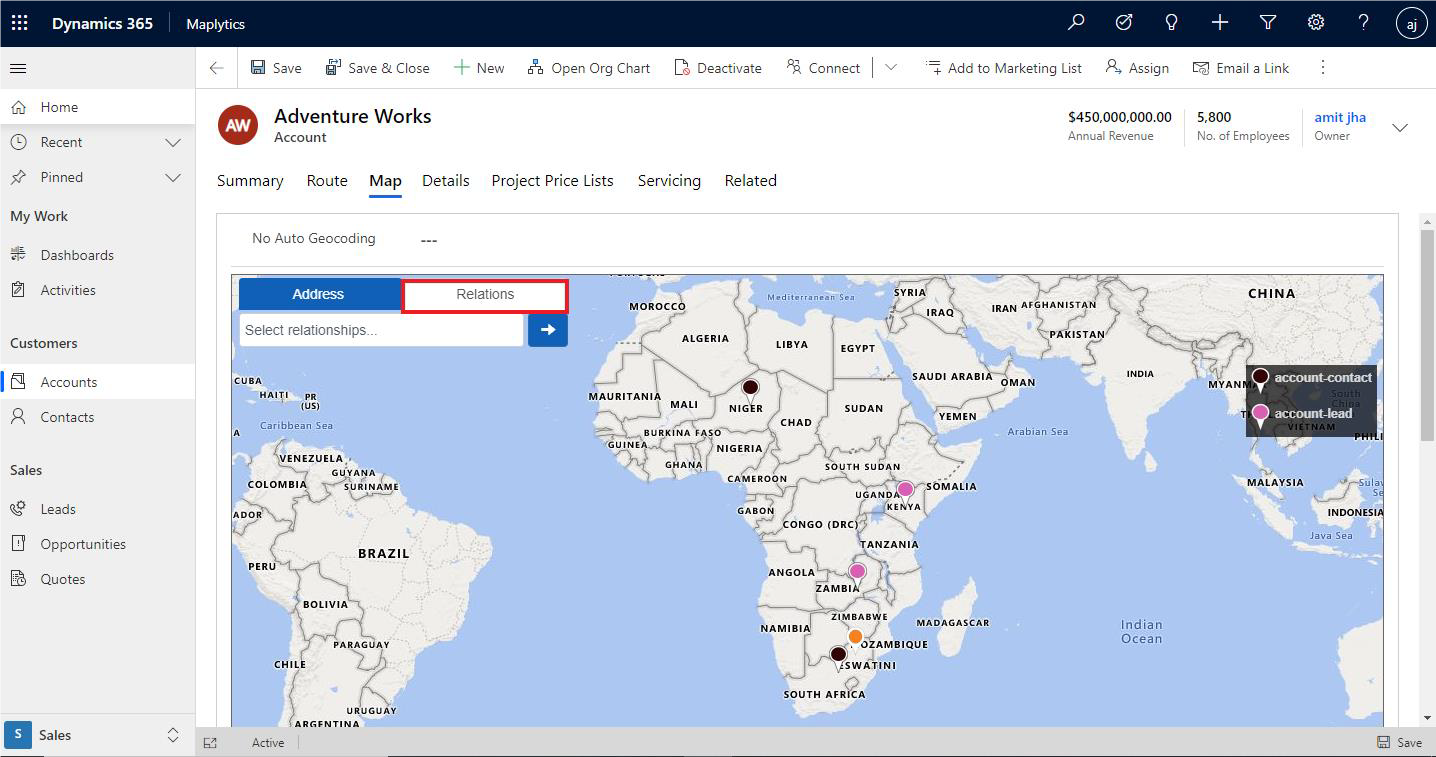
With this feature, the users can click on the ‘Relations’ drop-down to select the available relationships for the given Entity. Related records correspond to all 1:N and N:1 relationships between the plotted Entity. The user can further see related record information by clicking or hovering over it.
The required attributes such as Email Address, Contact, etc. can be selected within the entity map to be displayed on hover or click. The user can view at max, 5 relationships at once.
Default relationships can also be selected that will be plotted by default whenever this map is loaded. In the case of our client, their pushpin and that of their competitors were default relationships. At a maximum, the user can select five Default relationships.
Users can also select the color and pushpin icons for the related records.
In the image below, two relationships (Account-Contact and Account-Lead) are plotted for the account “Adventure Works”.

Propagating the use of Related Records
Once successfully assimilated by our construction industry client, we were able to recommend the use of Related records to many banking clients. They kept track of all their branches within the area and track the route of the treasury truck.
A veterinary client also was able to adopt Related Records to monitor and find the nearest blood banks, rescue centers, etc. from the site of injured or rescued animals.
The application of a good feature is limitless!
What’s More?
The unique features of Maplytics could be experienced when explored more with a trial. One can write to the Team at crm@inogic.com for mapping requirements, a free trial of 15 days, or a personalized demo within Microsoft Dynamics 365 CRM / Dataverse.
To learn more about Maplytics, its applications across industries, and another multitude of features, do visit the Website or the Microsoft AppSource. For further details, one can hop on to the Blogs, Client Testimonials, Success Stories, Industry Applications, and Video Library for a quick query resolution.
Until then,
Happy Relation!


