To manage your routine activities smoothly managers should always be updated with each and every process running in the organization, be it appointments of salespersons, territories assigned, leads or opportunities per month, routes followed by salespersons. There is so much to do and you cannot go and check everything in detail every time.
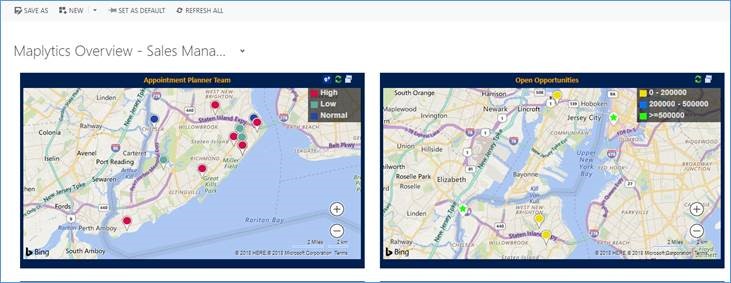
Maplytics dashboards are a great way to visualize your Dynamics 365 CRM data at a glance. Maplytics is currently shipped with five pre-defined dashboards and you can always create customized dashboards and categorize this dashboard data as per your business need.
The various aspects of Maplytics Dashboards in your MS CRM are:
- Real-time data – Data for an organization changes each and every minute. So, updating data every time becomes of utmost importance. Maplytics dashboards help to view the data in real-time. Each time the data is updated, Maplytics plots the updated records and provides the real-time view.
- Ready views – Many of the data needs to be compared or seen along with other data, so the user can also create views by filtering the data according to the need, creating a view and saving it as a Maplytics dashboard. For ex- A view can be created for sales which occurred only in the period of a particular festival week.
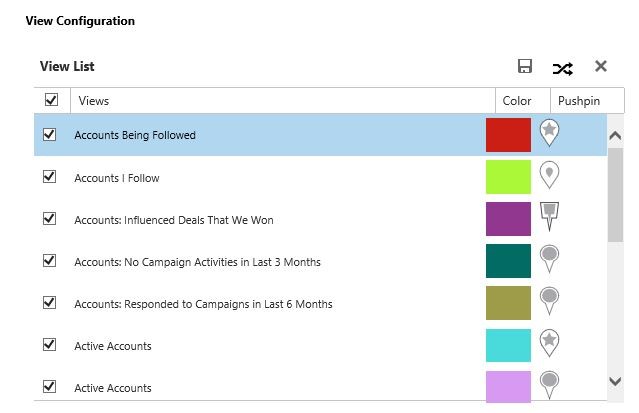
- Customize the visuals – Data points plotted on the maps can be customized according to the User can select which type of pushpins should be shown for which data and in which color.
- Category configuration – The data can also be configured according to the different parameters which are added to the This function distinguishes the data according to the category defined which further makes it simpler to understand the data.
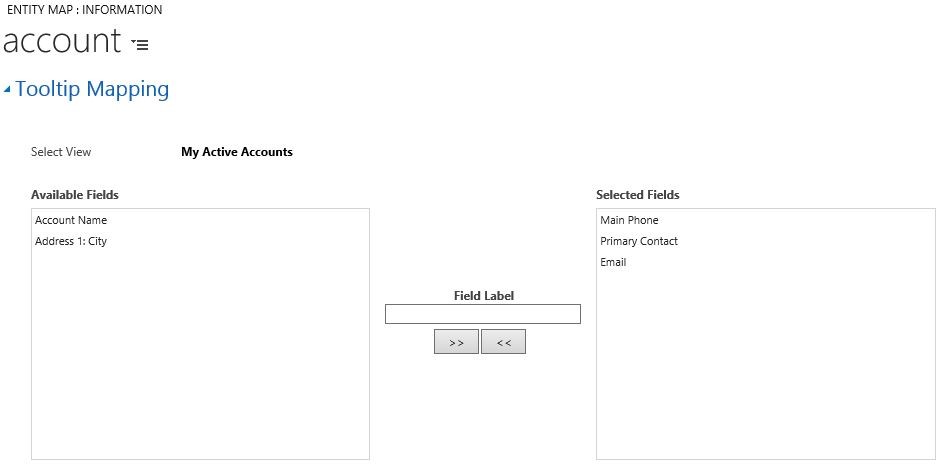
- Tool tip mapping – The plotting of map also gives you a quick look into the information about the particular data point. A user can decide which information should be visible if clicked on any of the pushpins.
- Competitor’s data – Various Maplytics dashboard views can be added to a CRM dashboard. A user can add his own organization’s data as well as his competitor’s data on two different Maplytics dashboard views and can view in a single CRM dashboard. This will help to compare organization’s data with its competitor’s
- Easy Analysis – To run a business one of the most important part is analysis. Maplytics helps to analyze the data on the dashboard. It allows the user to expand the map into a new window and further drill down the On the basis of the analysis, one can take necessary actions as well. Mass actions feature on the view grid allows the user to quickly manage different actions like manage territory, add a task, send email etc.
Using Maplytics Dashboards you can analyze your data in a more detailed form within your MS CRM, and be updated on a real-time basis.
Get started with Maplytics by downloading a free trial from our Website or Microsoft AppSource.
Happy Mapping!


