In the business world, data is everywhere—spreadsheets, CRM systems, customer lists, survey results, and more. But raw data sitting in files is just numbers and text until you can visualize it in a meaningful way. This is where Maplytics’ Plot from File feature steps in, transforming external data into actionable insights on a map—directly within Dynamics 365!
 Whether you’re a sales manager analyzing regional performance, a field service planner optimizing team deployment, or a marketer identifying customer hotspots, this feature simplifies decision-making with interactive, location-based data visualization.
Is This a Game-Changer?
Traditionally, if you wanted to analyze data within Dynamics 365, you had to import records into the CRM through a time-consuming process. This also meant an additional storage space requirement with increasing records. Plot from File eliminates this. Now, you can instantly upload an external file (like an Excel spreadsheet) and plot its records directly on a map without adding them to Dynamics 365.
Applications of Plot from File
Let’s break it down with some real-world applications.
-
Market Research & Business Expansion
Imagine you are a retail business planning to open a new store. You have a spreadsheet with competitor locations, customer surveys, and high-traffic areas. Instead of blindly choosing a location, you can now plot all this data onto a map, overlaying it with your existing store locations to find the best expansion spot.
-
Sales Strategy & Lead Targeting
Your sales team has just received a list of potential leads from a conference in an Excel file. Instead of entering each contact into CRM, you can use Plot from File to visualize where these leads are located, group them by region, and plan sales visits efficiently—all in just a few clicks.
-
Field Service Optimization
A logistics company frequently receives third-party vendor lists for delivery locations. With this feature, they can instantly map out delivery stops, analyze routes, and ensure efficient coverage without importing data into CRM every single time.
-
Event Planning & Site Selection
In case you are an Event person planning an event, upload a file containing the addresses of potential venues, nearby hotels, and transport hubs. By plotting these points on a map, you can visually assess the best location based on accessibility and convenience for attendees.
-
Analyzing Survey Data & Public Information
Government agencies and NGOs often work with public datasets such as census data or survey responses. Instead of manually entering thousands of addresses, they can upload an Excel file, map the data, and instantly see trends, clusters, and key areas of focus.
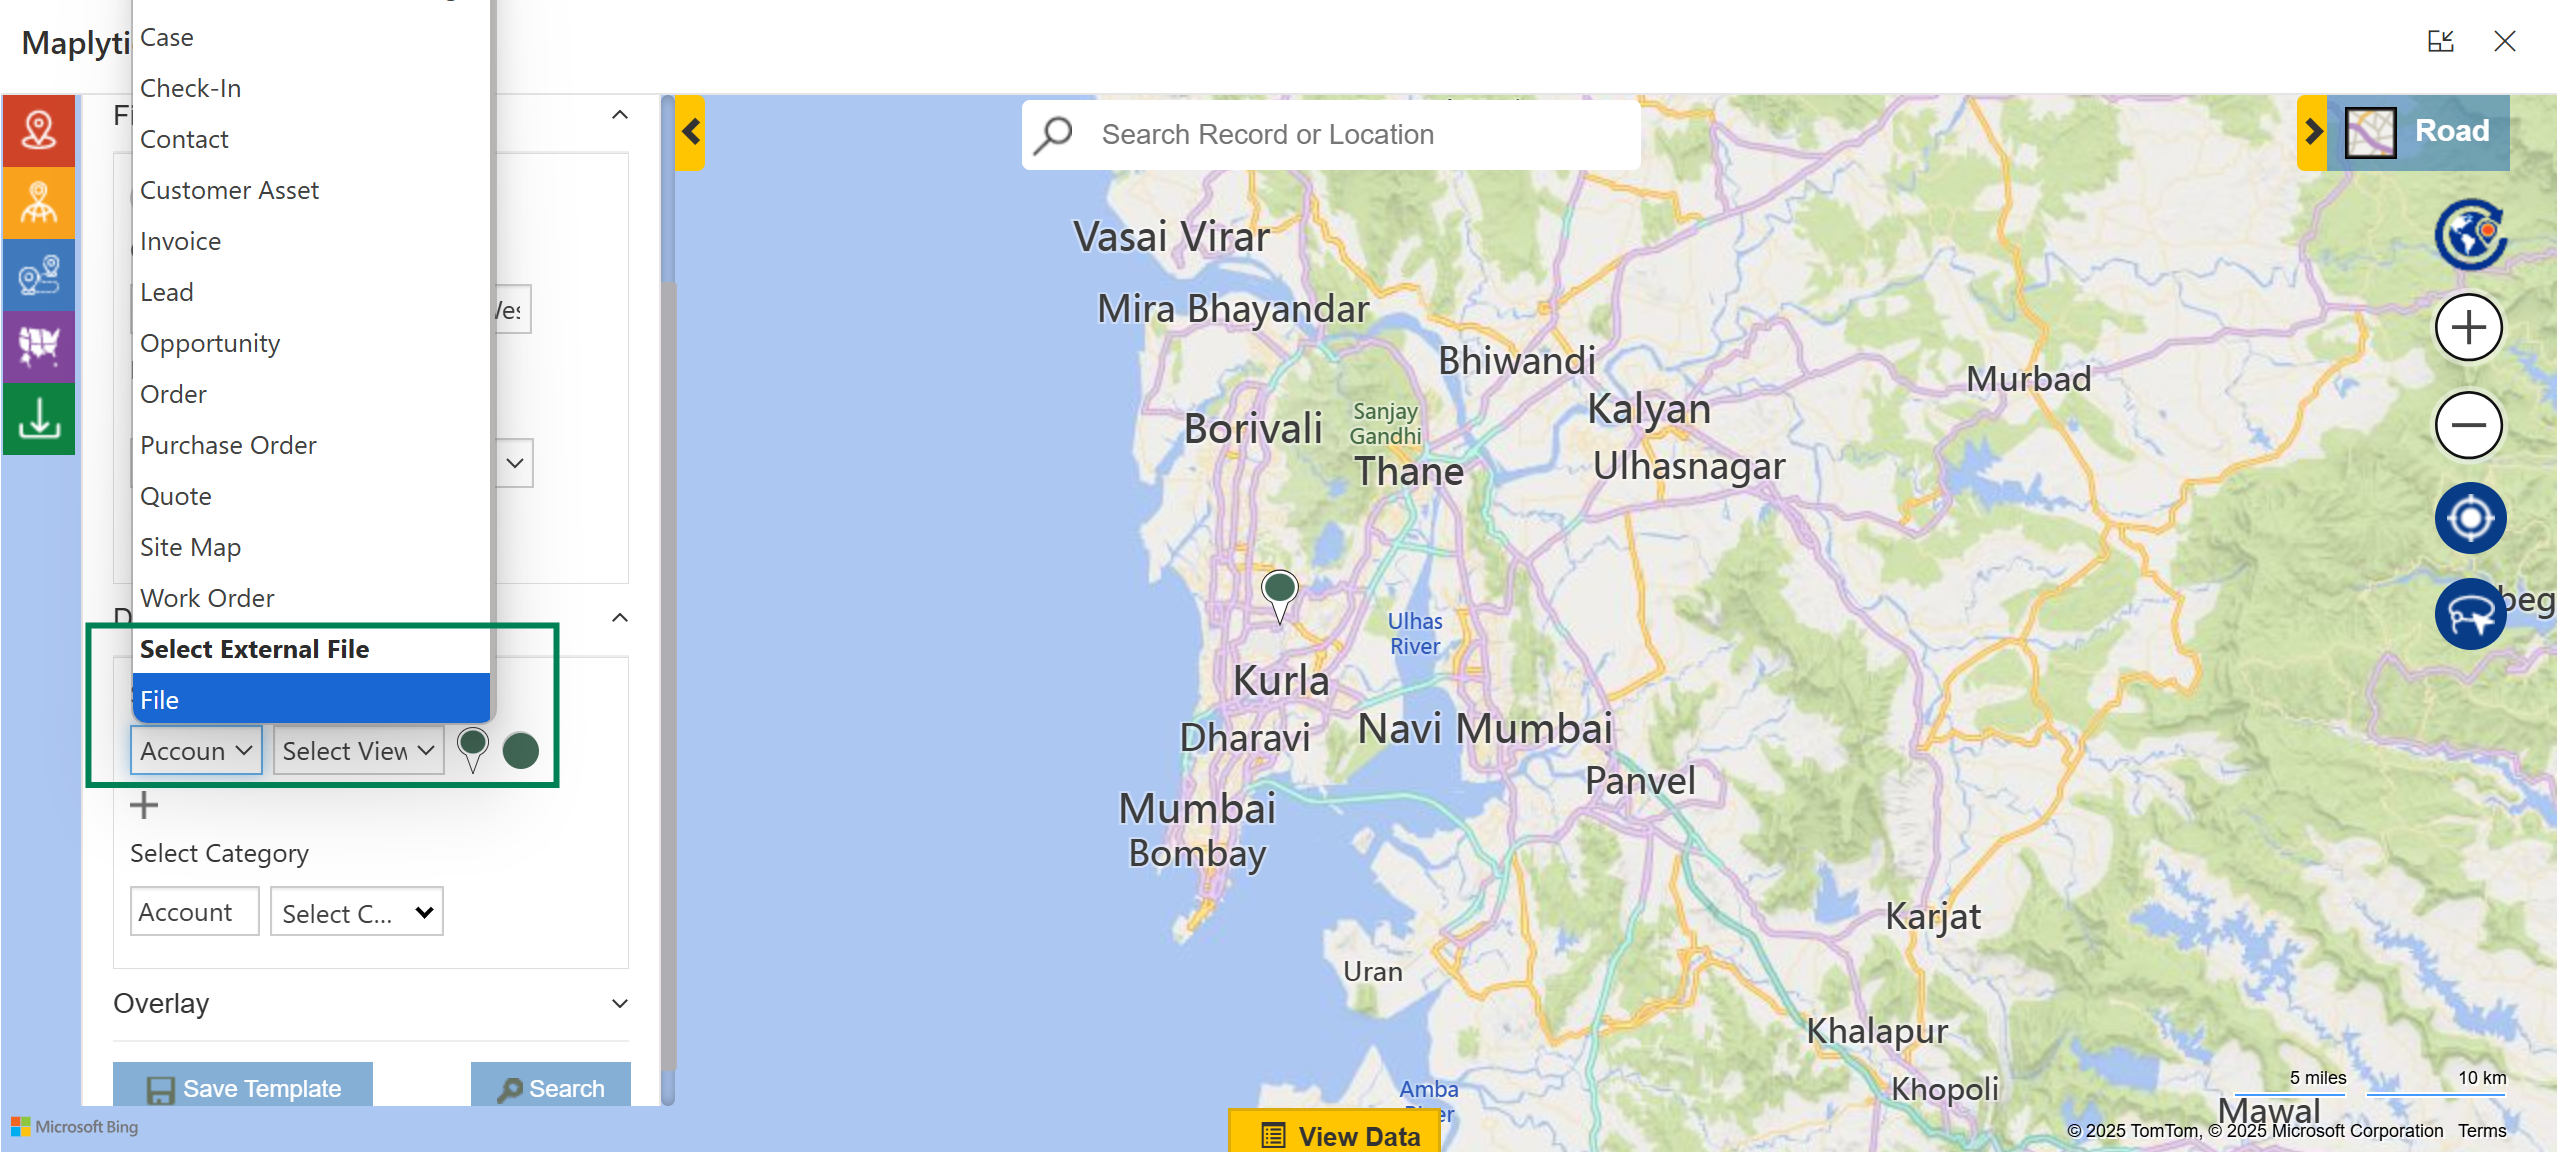
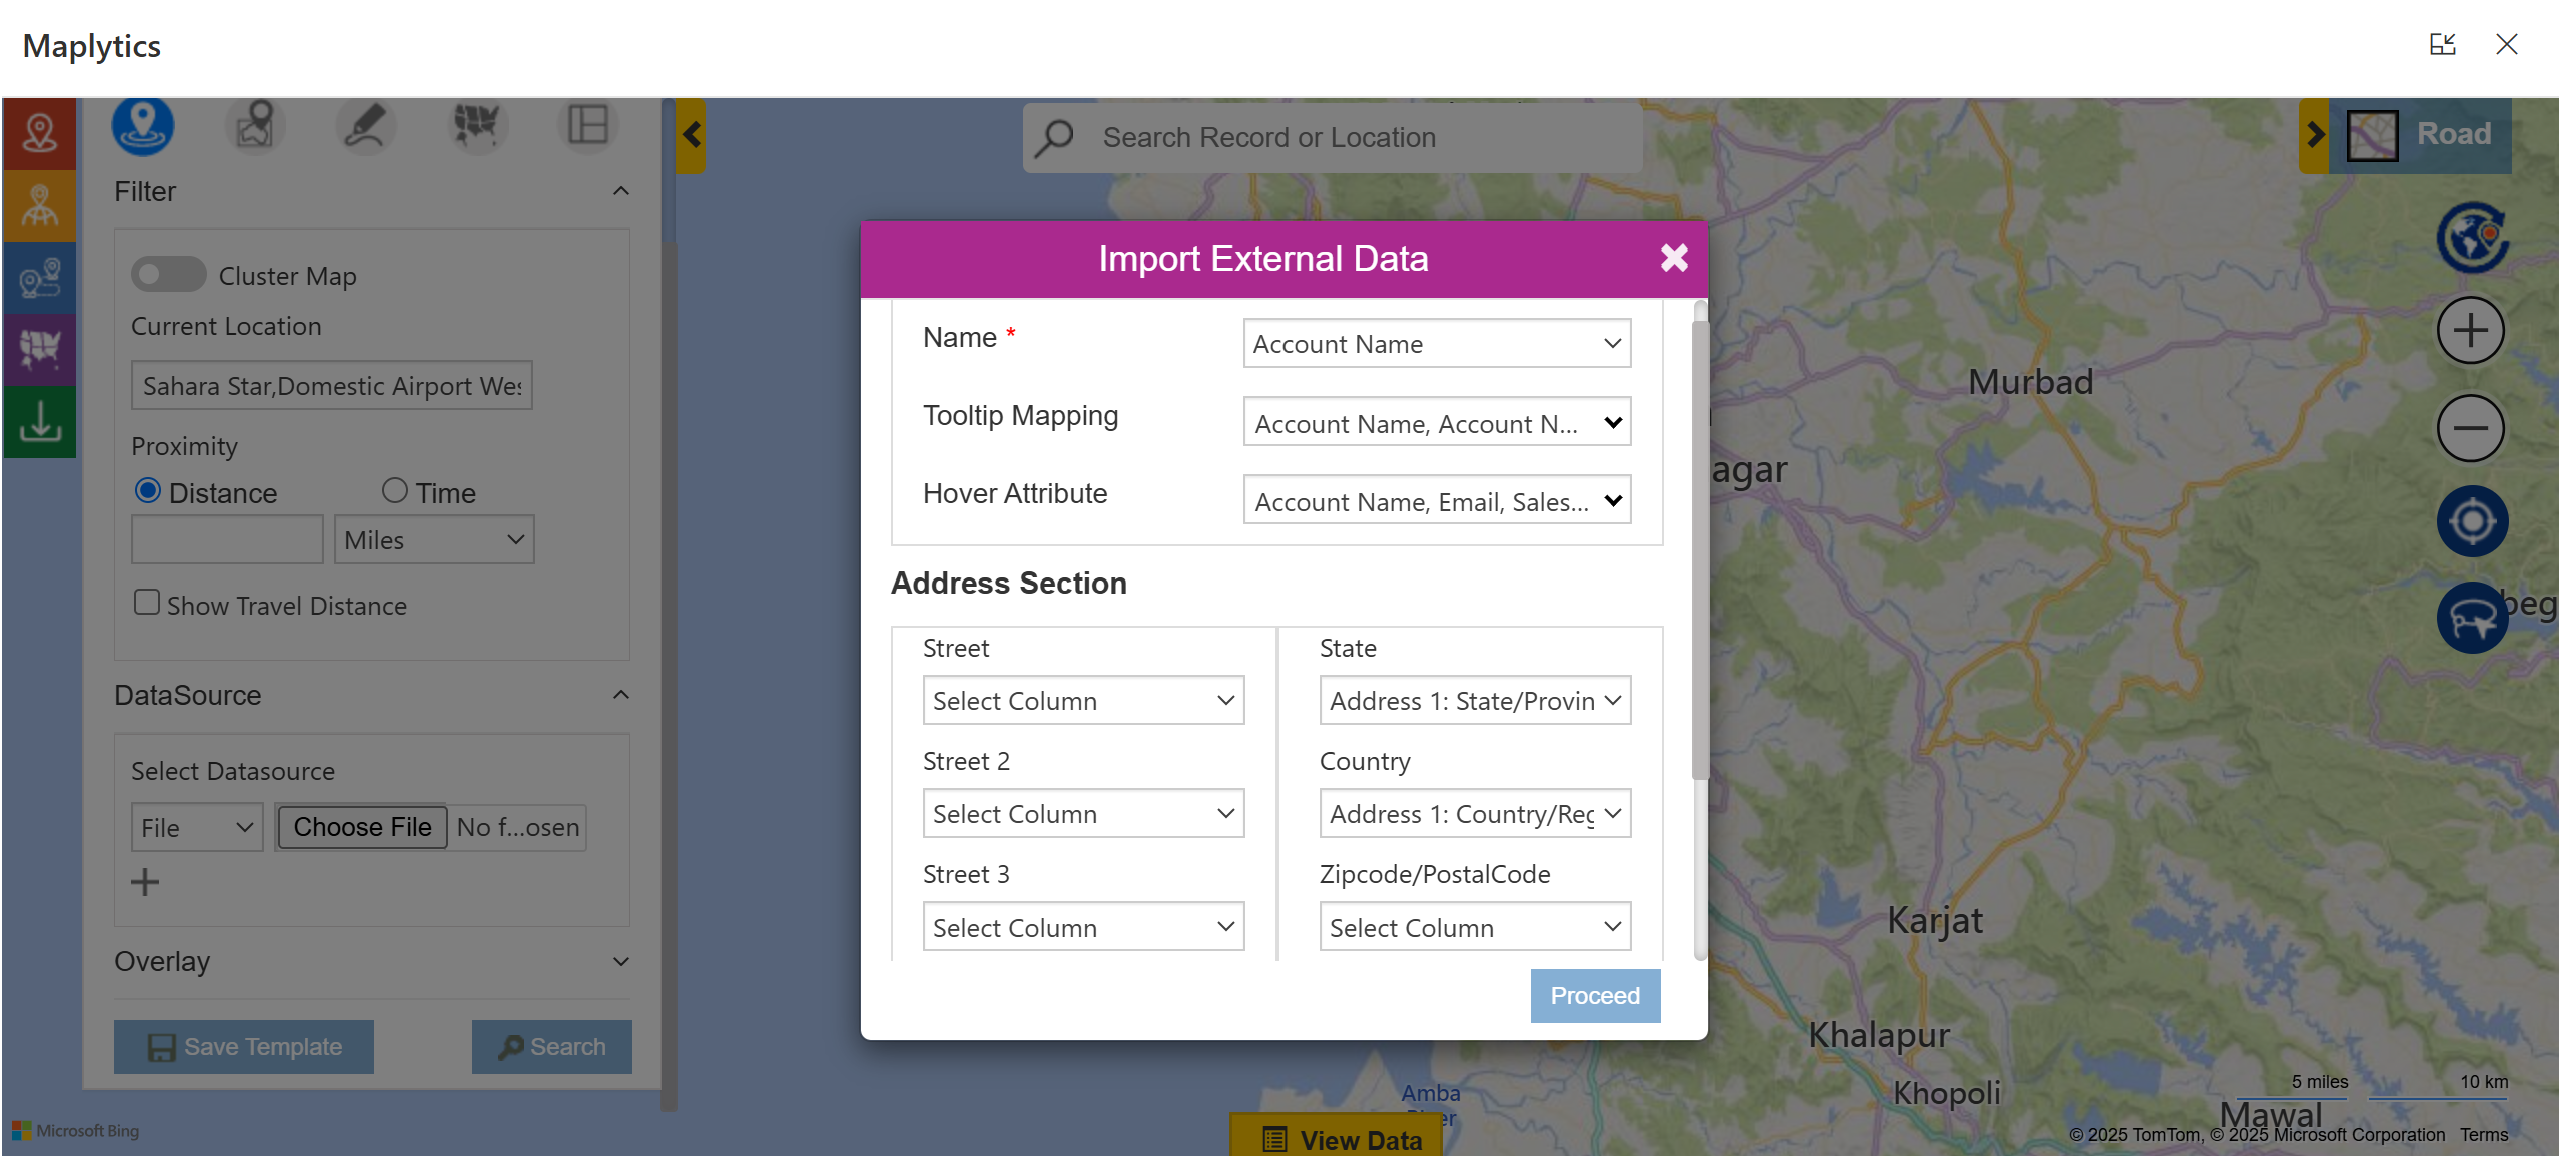
What is the Science Behind This?
It’s as simple as it sounds. All you need is an external file (Excel or CSV format) with location-based data such as addresses or latitude/longitude coordinates. Upload the file into Maplytics, and watch as the records instantly appear on a fully interactive map inside Dynamics 365.
You can check out the complete technical working of ‘Plot From File’ in Maplytics’s Technical Docs.
What are the Benefits of Using ‘Plot from File’
- Skip the CRM import process and plot data instantly.
- Visualize external data alongside your existing CRM data.
- No need to permanently store records in Dynamics 365.
- Optimize travel routes and resource allocation based on mapped data.
- Use real-time visuals to analyze trends and make data-driven decisions.
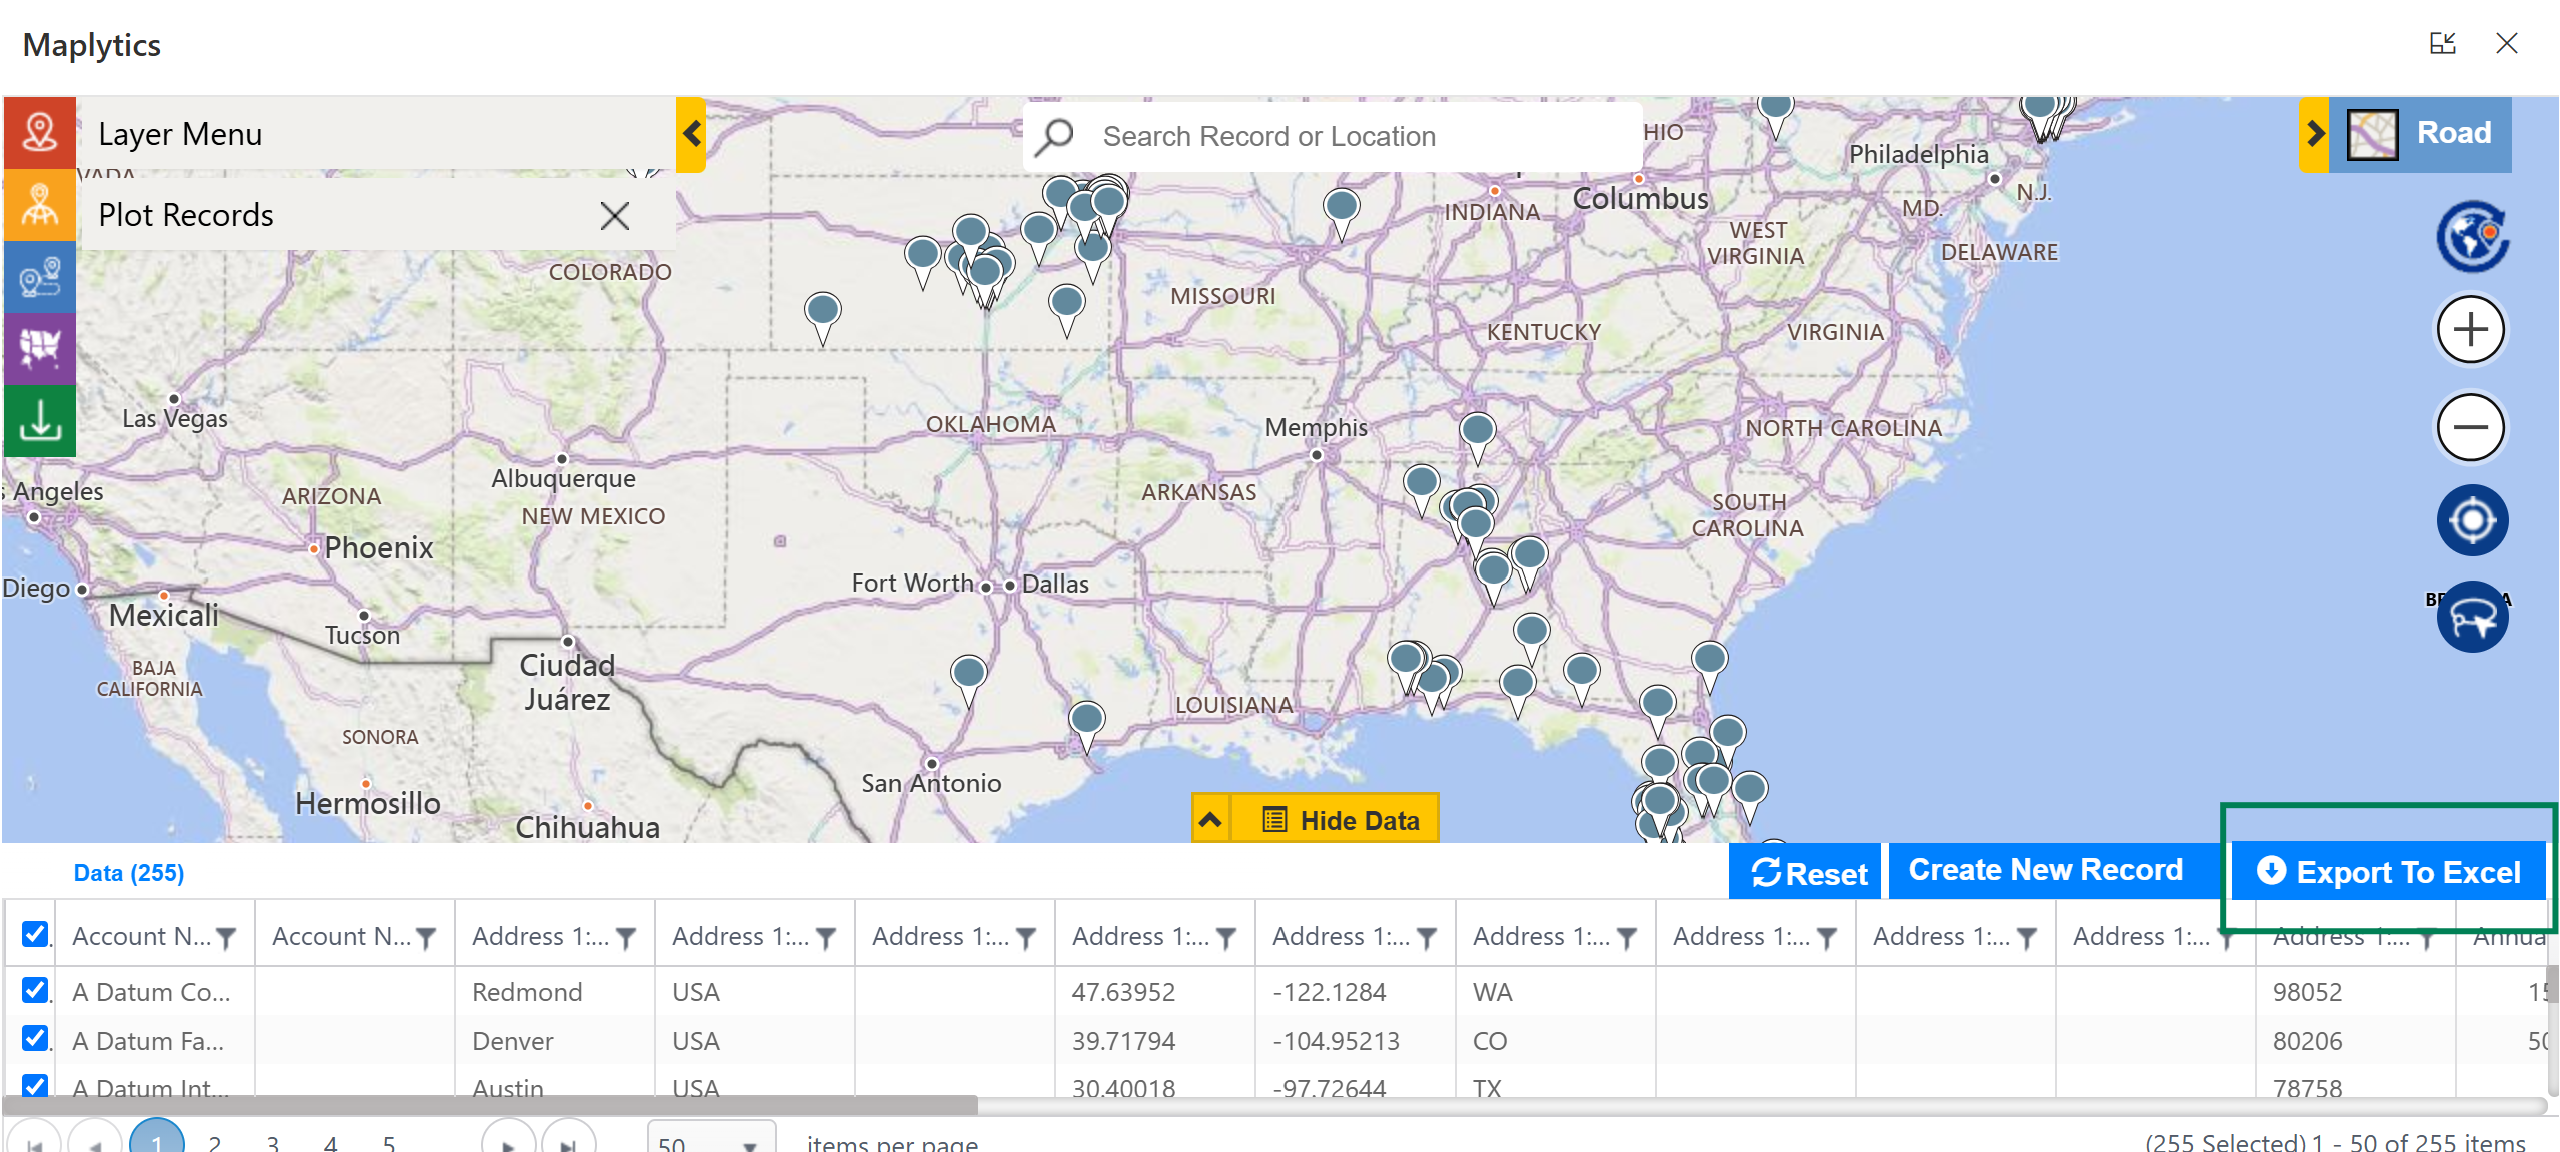
- Store the modified data back in Excel for future use.
 Maplytics’ Plot from File feature isn’t just about convenience—it’s about empowering businesses to make smarter, faster decisions by bridging the gap between external data and CRM insights.
What’s More?
Maplytics is like water that can be molded into any role. It makes Bing Maps and Azure Maps integration within Dynamics 365 look seamless. Radius Search, Route Mapping, and more have become super easy to use. To get more acquainted and experience it first-hand, one can write to crm@inogic.com. To investigate the product further, with a personalized demo within Microsoft Dynamics 365 CRM / Dataverse, get in touch with the team. For applied knowledge, do visit our Website or Microsoft AppSource. One can hop on to the detailed Blogs, Client Testimonials, Success Stories, Industry Applications, and Video Library for a quick query resolution. You can check out our technical tutorial video series #KnowYourMaplytics here, and for fun Tips & Tricks about Maplytics, have a look at our series #ProAtMaplytics here. Technical docs for the working of Maplytics are also available for reference.
You can also leave us a review or write about your experience on AppSource or the G2 Website.