Census data empowers businesses to get the facts straight about the typical characteristics of their potential customers in a particular region. Knowing the composition of the population in terms of age, gender, income level, etc. will strengthen their go-to-market strategy. Moreover, business owners can make use of this valuable information from census data to analyze market demands and take informed decisions.
What is Census Data?
Broadly speaking, a census is the official enumeration of people in a particular area at a given time. In many countries, census data is collected after a period of 10 years to monitor diverse elements of the population. Census data is the foundation of government policies directed at the welfare of the citizens and improve their standard of living. Business organizations too, can segregate this data into area land, population in age range, density of population in a region, etc. to meet their goals.
Census data for business decisions
Conducting market research is an integral part of opening a new business. An entrepreneur should sincerely consider various factors before starting a new venture. What is the density of population of my target customers in a zipcode or a defined region? What is the demographics and psychographics of the customers in an area? Is the purchasing power of the people living in that area good enough to get return on investment? Finding answers to these questions beforehand will allow the organizations to successfully advertise and sell their products.
Visualizing Census data with Maplytics
As census data is a piece of action for the business organizations, Maplytics within Dynamics 365 CRM gives the privilege to users to visualize Census data and other details of population demography on a map. This will assist businesses to plan their strategy in a particular market region. Additionally, using the information of Census data to enrich customer database in Dynamics 365 CRM is icing on the cake for those organizations.
Some census files like US Counties, States and 111th Congressional States, England-cities, Germany-postal codes, etc. are available by default in Maplytics. Having said this, the users can use their own shape files of census data to visualize the same on a map. To visualize census data on map in alignment with their needs, users can also configure the attributes and thereafter categorize those attributes to view color coded regions on the map to have a better view of the required demographics data. Let’s walk through a use case how configuring census data in Maplytics can be used for smart business decisions.
Dave Smith is the owner of two cosmetic stores in New York. He is looking to expand his business and has plans to open five new stores in the city. In order to select the best locations for his new stores, he wants to analyze market potential across segments. He uses the census data visualization feature of Maplytics to understand the population density in different zip codes of New York.
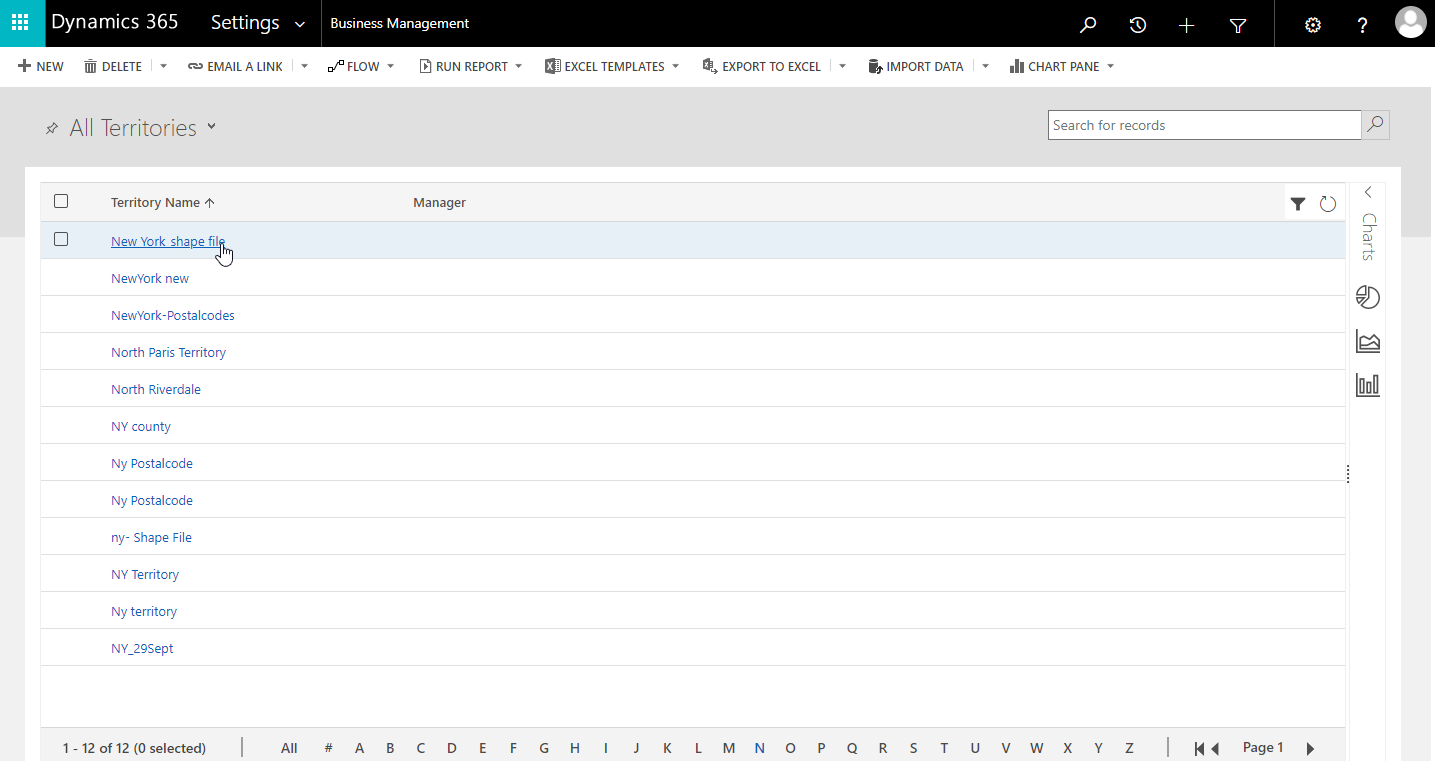
To visualize population details of New York on map, at first Dave needs to configure the census data file by using these steps: Go to Settings > Business Management > Sales Territories > Territories with census data/shape files saved > select the Census Data File (New York_Shape File).
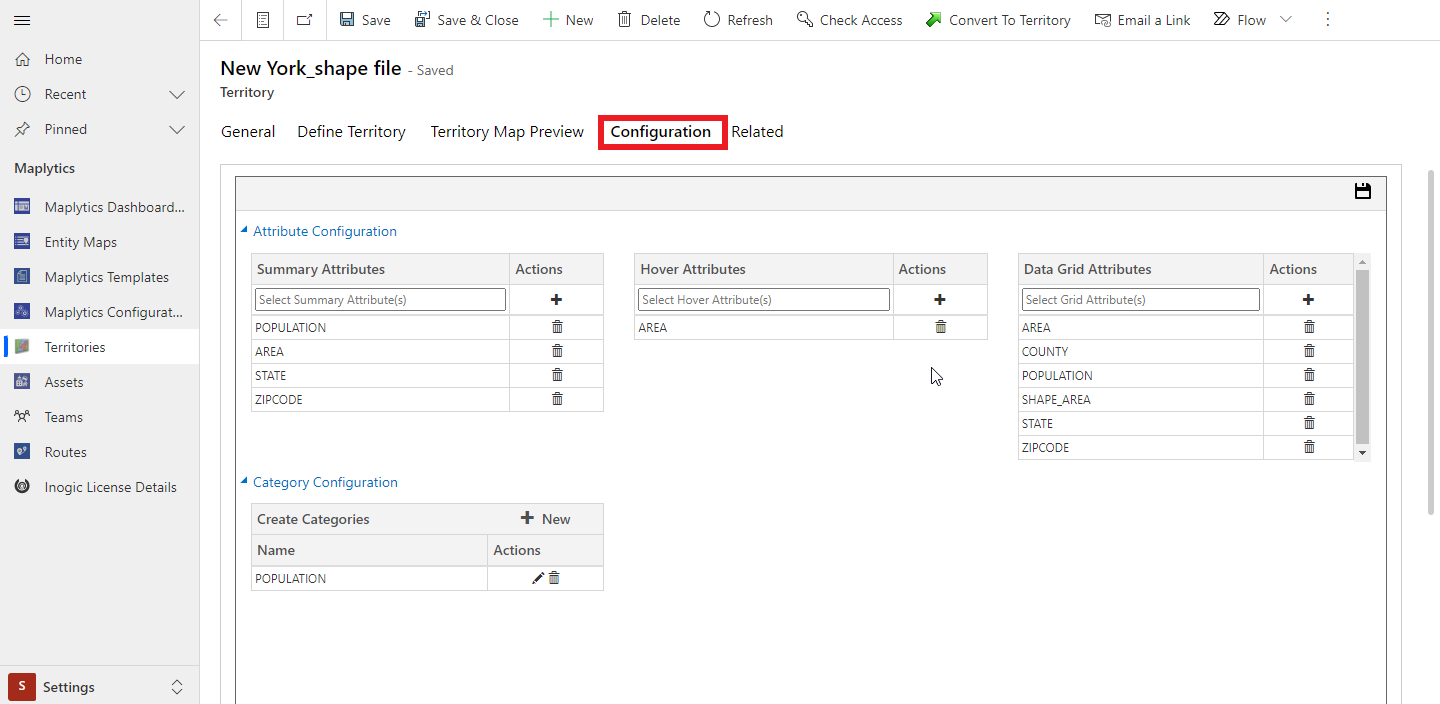
Click on ‘configuration’ button to customize the attributes. Here, users can choose the different attributes from the census data file that they desire to see in summary card, hover and data grid.
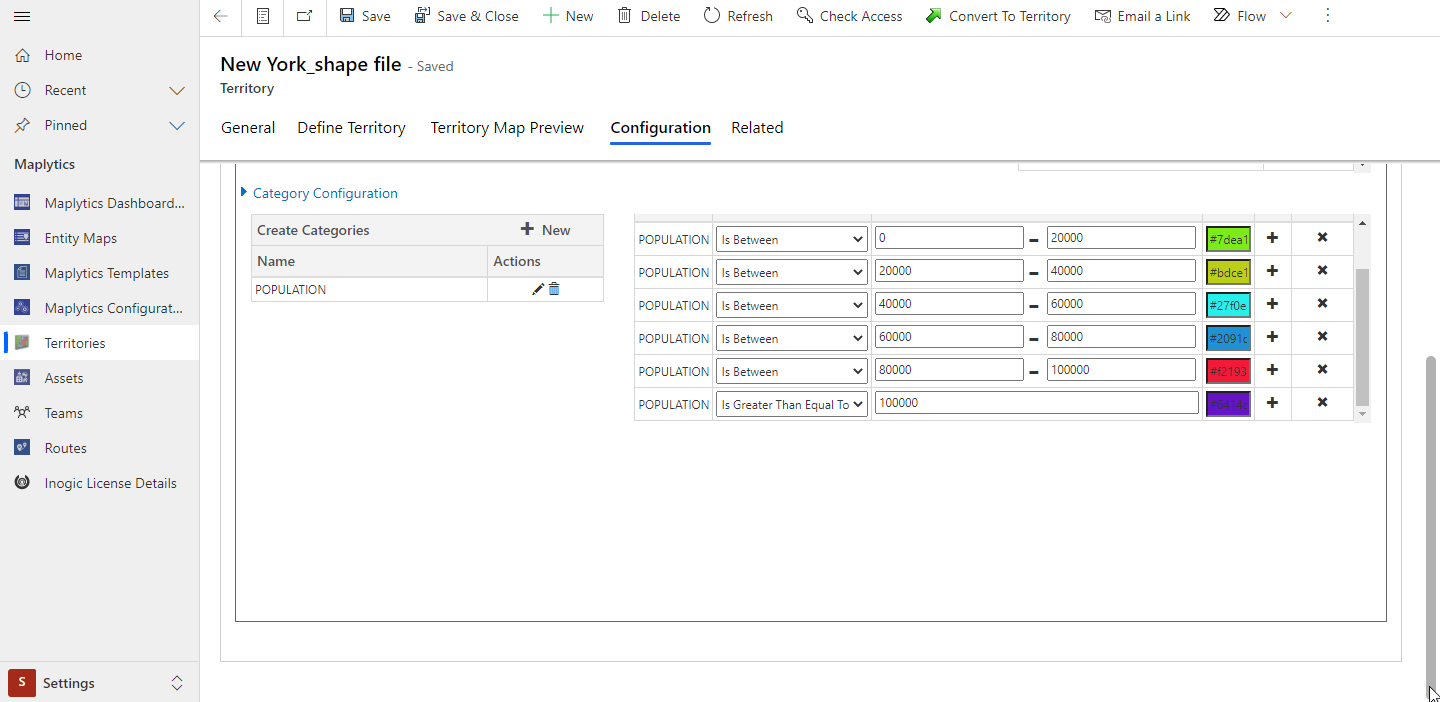
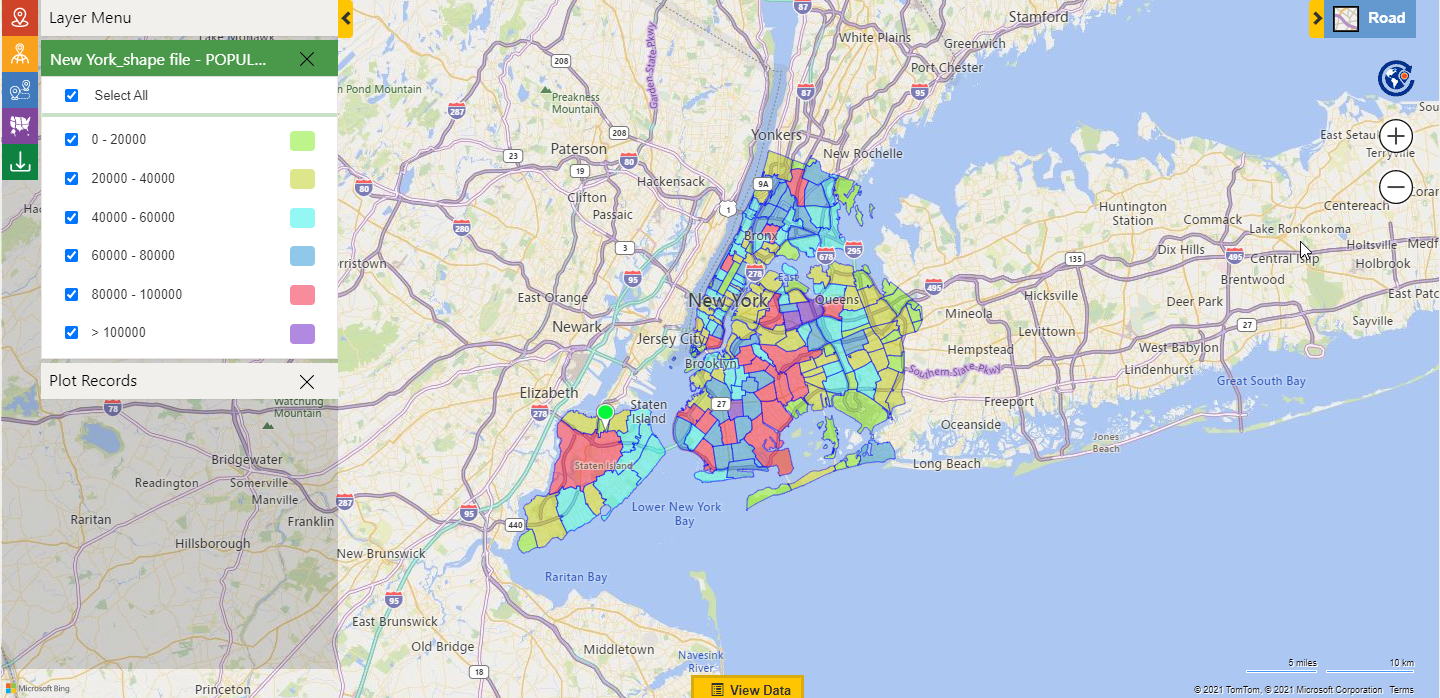
User can create categories for the attributes to view the color coded regions based on the configured categories using ‘category configuration’ option. In this case, Dave will select the ‘population’ as the category as he is interested in population distribution details of the city. He has created various ranges of the population and selected the color for the respective ranges.
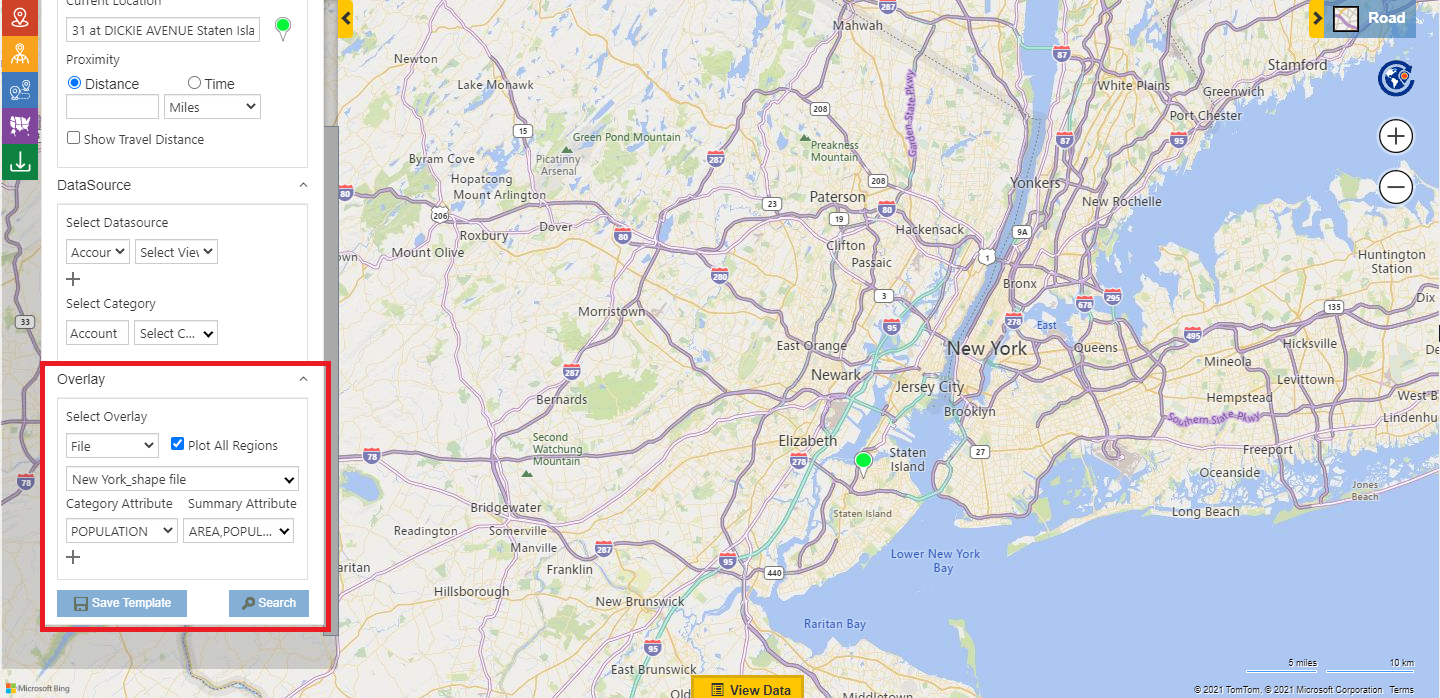
After configuring the attributes, user can go to Detail map to plot the census file and view the regions with the information on the population. They can follow these steps as shown in the image below: Open the Detail map > Overlay > File > Select required Shape file > Select the category attribute > Search. Here the summary attribute is already selected based on the configuration done earlier.
This allows Dave to compare population size of different areas of the city visible in different colours.
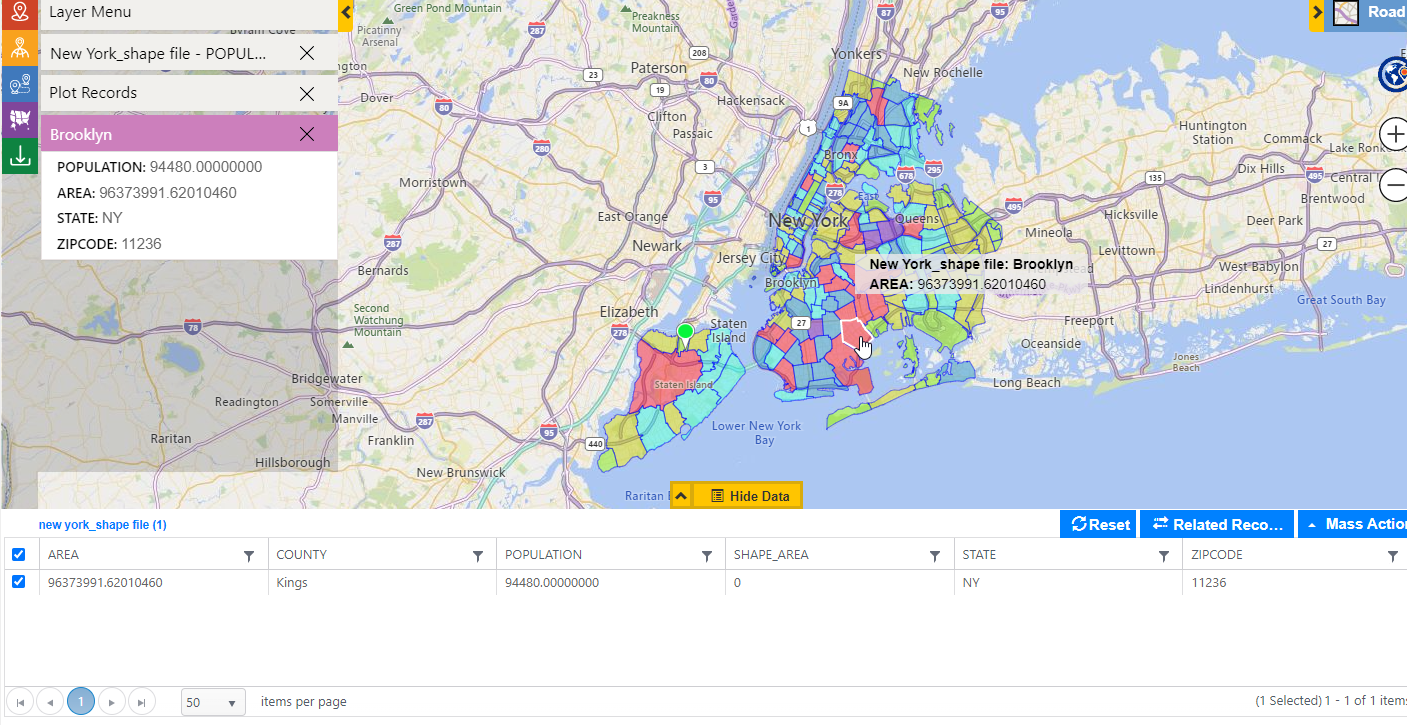
He can also hover and click on a zip code region to get its details as shown in the image below.
In this way, Dave can compare all the options available to him for his upcoming cosmetic stores. Further, to get insights according to the specific needs, users can configure different attributes like- population in a certain age group, gender data in a particular region, etc. All in all, Census Data Visualization feature should be at the heart of business organizations to take informed decisions.
Territory Management, Appointment Planning, Optimized Routing there’s much more in Maplytics, to know more about the different features of Maplytics, begin a free trial today from our website or Microsoft Appsource. You can also contact crm@inogic.com to check how Maplytics can assist you with your specific Location Intelligence needs.

