Well, we don’t need to talk about how important it is to get feedback from your customers which helps you to understand how they actually want your product/service to be. Today, let’s go through one such case where we will see how Maplytics has been helping businesses with its analytical power within your Dynamics 365 CRM on a map. Maps are not just about improving efficiency of routes, planning appointments or smartly creating territories anymore, they now play a crucial role in success of many businesses and organizations around the globe!
Well, we don’t need to talk about how important it is to get feedback from your customers which helps you to understand how they actually want your product/service to be. Today, let’s go through one such case where we will see how Maplytics has been helping businesses with its analytical power within your Dynamics 365 CRM on a map. Maps are not just about improving efficiency of routes, planning appointments or smartly creating territories anymore, they now play a crucial role in success of many businesses and organizations around the globe!
Well, we don’t need to talk about how important it is to get feedback from your customers which helps you to understand how they actually want your product/service to be. Today, let’s go through one such case where we will see how Maplytics has been helping businesses with its analytical power within your Dynamics 365 CRM on a map. Maps are not just about improving efficiency of routes, planning appointments or smartly creating territories anymore, they now play a crucial role in success of many businesses and organizations around the globe!
Let’s say Claire, who is the head of the service department puts feedback on highest priority. She needs to receive feedback from each of her customers regarding services provided to them. For this she wants the research department to send their team to conduct customer satisfaction survey for all the customers whose cases have been handled.
To keep the service and research matters separate, Claire can provide case ids only so that the research department can track the case ids and conduct survey for customers.
To conduct survey, the research department would need to plot the locations on the map so as to plot the route for their team. In this instance, let’s see how to plot a custom entity which doesn’t have its own address and is linked to an OOB entity which also does not have its own address. With the help of combination of dashboard and entity map within Maplytics, we can plot a nested entity on the map.
Claire has created a custom entity with the name ‘Feedback Survey,’ which is created after the case is resolved as she needs feedback of the customer to measure customer satisfaction. So, if any case is resolved, 1 feedback survey entity record gets created which is linked to the entity ‘Case.’ In this instance ‘Case’ doesn’t have its own address field, the address field values are fetched from look up field of Entity ‘Customer.’ So, when the user plots ‘Feedback survey’ it will take geo-coordinates from ‘Customer.’ As this entity is nested, Claire has asked the administrative department to create a Maplytics Dashboard & entity map for ‘Feedback survey’.’ After creating this, user can plot the records of entity ‘Feedback survey’ with the help of Maplytics within Dynamics 365 CRM.
Step 1: Create dashboards records, with nested Entity as shown in below screenshot. Go to Settings > Maplytics Dashboards > New
- Enter Dashboard Name: Active Feedback survey
- Entity name: Logical name of Entity
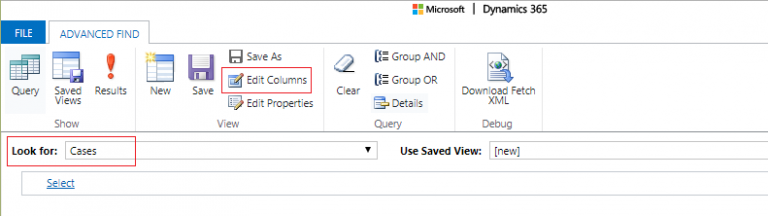
- Query: Create Query for this > Open Advance Find.

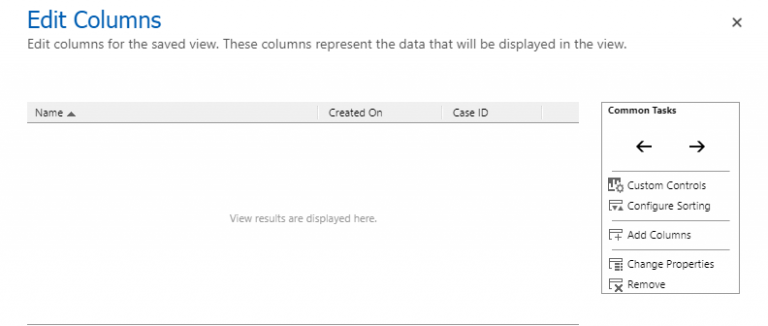
- Select “Cases” in ‘Look for’ drop down and click on “Edit Column” as shown in below screenshot.
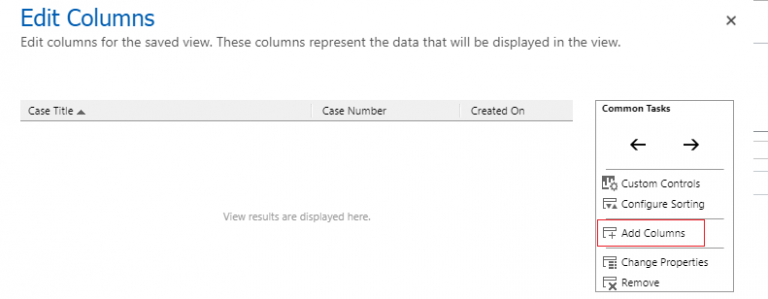
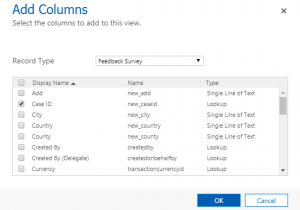
- Click on Add Column.
- Select Record type: Customer (Account) and select address field shown in below screenshot. Click on “OK”
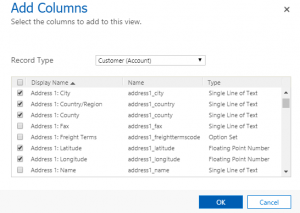
- Click on “Download Fetch XML”.
*Note: If it’s other than Account entity select all Address fields of respective entity.
You can see xml same as below.
<fetch version=”1.0″ output-format=”xml-platform” mapping=”logical” distinct=”false”>
<entity name=”incident”>
<order attribute=”title” descending=”false” />
<link-entity name=”account” from=”accountid” to=”customerid” visible=”false” link-type=”outer” alias=”a_206f9901f7bde811a982002248004a4b”>
<attribute name=”address1_longitude” />
<attribute name=”address1_latitude” />
<attribute name=”address1_county” />
<attribute name=”address1_country” />
<attribute name=”address1_city” />
<attribute name=”address1_postalcode” />
<attribute name=”address1_line3″ />
<attribute name=”address1_line2″ />
<attribute name=”address1_line1″ />
<attribute name=”address1_stateorprovince” />
</link-entity>
</entity>
</fetch>
Note: You need to change alias name “a_206f9901f7bde811a982002248004a4b” with “maplyticsacc”
- The above XML is for getting all the Address field, now we have to create Fetch XML for Custom Entity i.e. ‘Feedback survey.’
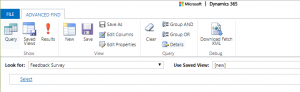
- Select ‘Feedback survey’ in Look for field.
- Click on “Edit Column.”
- Click on Add Column
- Select “Feedback Survey” in Record type & check “Case ID”.
- Click on OK
- Click on “Download Fetch XML.” It will look like below:
<fetch version=”1.0″ output-format=”xml-platform” mapping=”logical” distinct=”false”>
<entity name=”new_registration”>
<attribute name=”new_registrationid” />
<attribute name=”new_name” />
<attribute name=”createdon” />
<order attribute=”new_name” descending=”false” />
<link-entity name=”incident” from=”incidentid” to=”new_caseid” visible=”false” link-type=”outer” alias=”map”>
<attribute name=”customerid” />
….Paste here…..
</link-entity>
</entity>
</fetch>
Note: You need to change alias name “a_206f9901f7bde811a982002248004a4b” with “map”
Copy the following downloaded xml in the above mentioned xml in the place of “paste here” and paste this fetch xml in query.
<link-entity name=”account” from=”accountid” to=”customerid” visible=”false” link-type=”outer” alias=”maplyticsacc“>
<attribute name=”address1_longitude” />
<attribute name=”address1_latitude” />
<attribute name=”address1_county” />
<attribute name=”address1_country” />
<attribute name=”address1_city” />
<attribute name=”address1_postalcode” />
<attribute name=”address1_line3″ />
<attribute name=”address1_line2″ />
<attribute name=”address1_line1″ />
<attribute name=”address1_stateorprovince” />
It will be shown as below:
<fetch version=”1.0″ output-format=”xml-platform” mapping=”logical” distinct=”false”>
<entity name=”new_registration”>
<attribute name=”new_registrationid” />
<attribute name=”new_name” />
<attribute name=”createdon” />
<order attribute=”new_name” descending=”false” />
<link-entity name=”incident” from=”incidentid” to=”new_caseid” visible=”false” link-type=”outer” alias=”map”>
<attribute name=”customerid” />
<link-entity name=”account” from=”accountid” to=”customerid” visible=”false” link-type=”outer” alias=”maplyticsacc”>
<attribute name=”address1_longitude” />
<attribute name=”address1_latitude” />
<attribute name=”address1_county” />
<attribute name=”address1_country” />
<attribute name=”address1_city” />
<attribute name=”address1_addresstypecode” />
<attribute name=”address1_postalcode” />
<attribute name=”address1_line3″ />
<attribute name=”address1_line2″ />
<attribute name=”address1_line1″ />
<attribute name=”address1_stateorprovince” />
</link-entity>
</link-entity>
</entity>
</fetch></fetch>
Step 2: Create 6 (Six) address fields in that Entity i.e.
- Address Line 1: Data Type – Single line of text
- City: Data Type – Single line of text
- Zip – Code: Data Type – Single line of text
- Country: Data Type – Single line of text
- Latitude: Data Type – Single line of text
- Longitude: Data Type – Single line of text
Step 3: Create New Entity Map, for reference please go through below blog.
Step 4: Open Detail Map
Select the Entity & Data source Your Dashboard Name
Select Category If you want and click on Search.
Note: You won’t be able to plot default system views as this is a multiple linked entity.
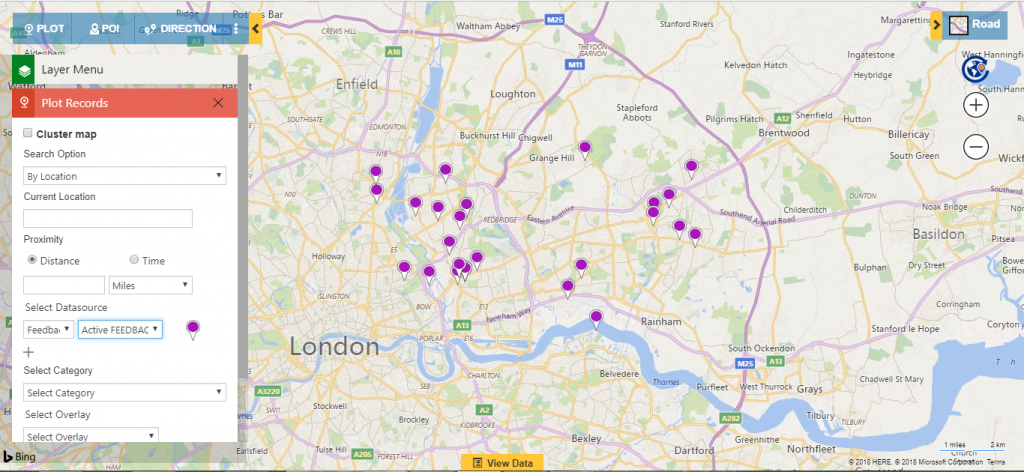
Note: You can plot only dashboard records for ‘Feedback survey.’ If you plot System view or any personal view it will not work.
Now that Admin has created dashboard to view the locations for the feedback survey records. The research department can easily plan an automated schedule for their team so as to conduct the survey for these customers. As they can visualize where the customer is located on map, the manager can make a plan where routes and appointments will be created following which the survey team can get feedback for Claire.
Now, Claire can use this feedback in the direction of making the company better. If the feedback is positive, she can reward her team members and boost their morale. However, if there is some complaint or requirement that is yet not met, Claire can motivate the team to work on the touch points and resolve the issue, which will again make their services better. Thus using the power of survey, she can improve her business strategy in exceptional ways.
Download the latest solution for free from website or AppSource to explore its features.
Happy Mapping!