In the first part of this blog, we gave you a sneak peek into the upcoming Maplytics October release and also shared the focus of the release which is empowering organizations with features that improve and compliments the Strategy-Making process.
Businesses create strategies based on the resources and analysis of business data to ensure their long-term growth and sustainability.
We gave you a sneak peek into the features like Auto scheduling, Territory Management, Pie and Column Charts in Heat Maps, and Security Templates that are going to be available with the upcoming Maplytics October release. These features enhance the way you use and analyze your Dynamics CRM data to formulate successful business strategies. Well, in this blog, we will give you a sneak peek of some more features that will help you to create successful business strategies.
Overlay Layer
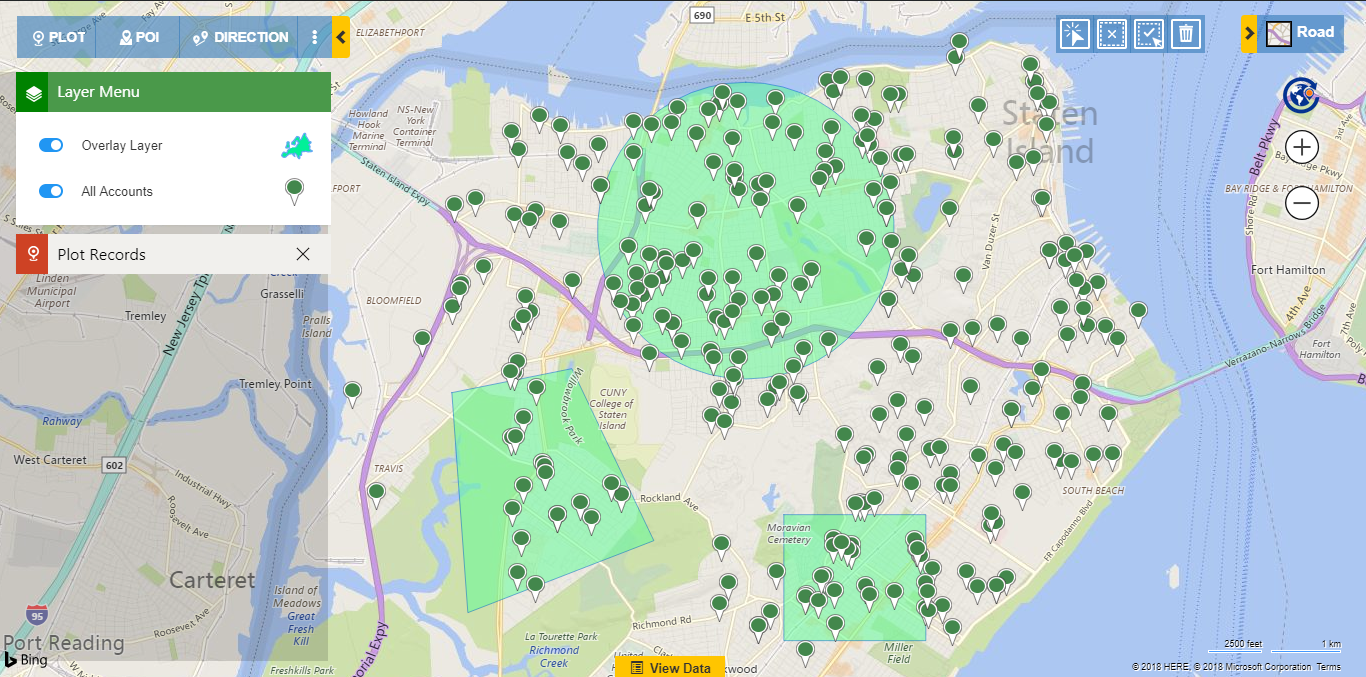
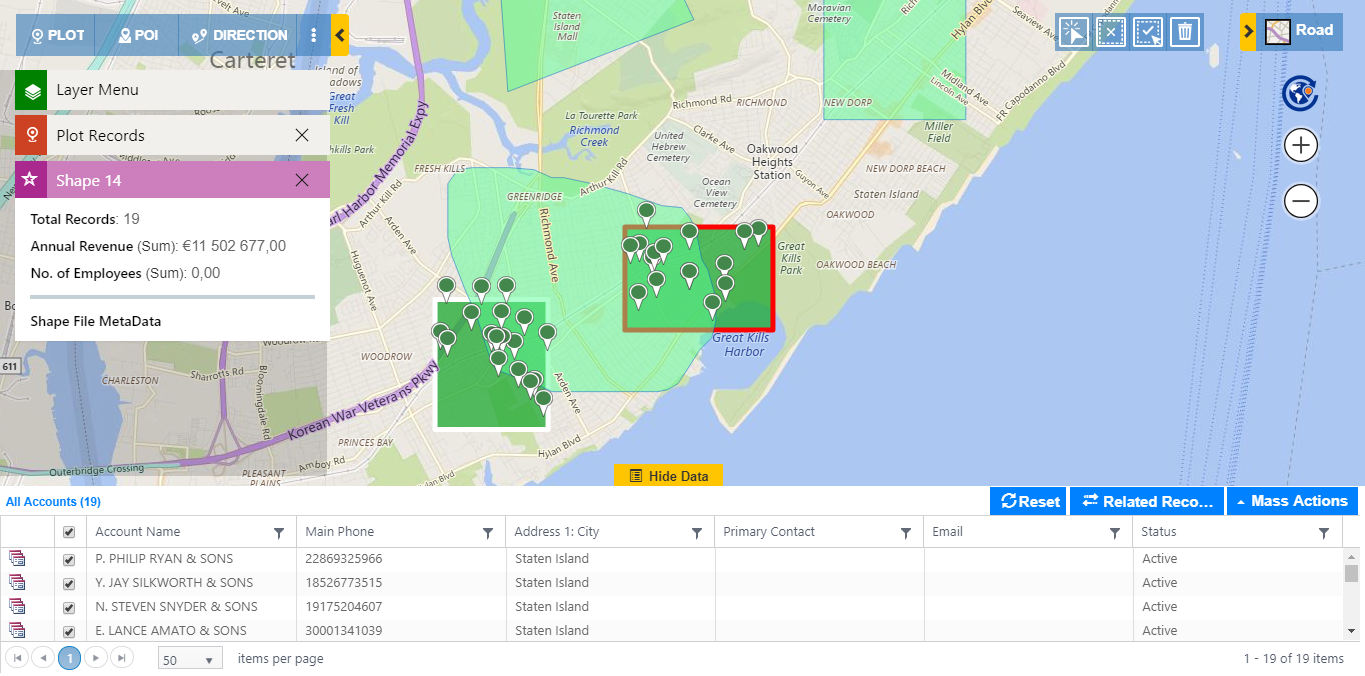
Overlay feature will allow you to visualize the shapes that you draw and the Dynamics 365 data as an overlay. Having the ability to visualize the Dynamics CRM data that lies outside of the shape as well gives you extra flexibility to work with your data. Sometimes you need to see the data that lies outside the shape or region that you want to analyze.
Using Overlay, users will now be able to plot the records along with any shapefile or territories in the form of layers. The user can also toggle between the layers of the overlay plotted. This will make it even easier to analyze the record spread over the regions of territories and shapes plotted on the map.
Auto Search Window
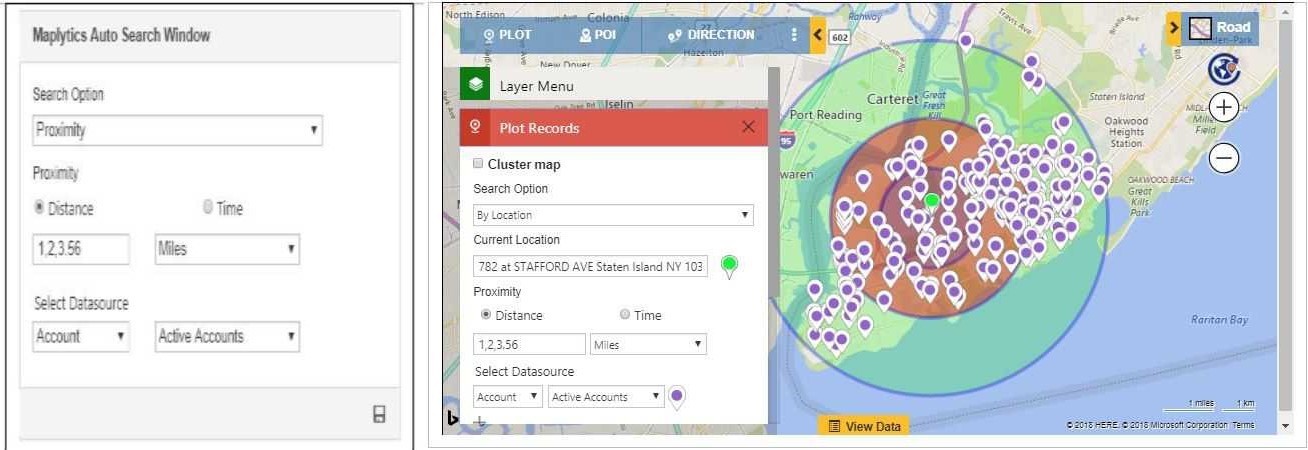
Whenever you needed to search records around an individual record, you needed to plot it on the map, set it as a current location and then perform the proximity search. With the upcoming Maplytics October release, we are introducing the Auto Search Window on the records where you can save the search criteria and every time you open the record; it will use that particular search criterion to plot the records around that individual record. You also have the By Region search option available.
This can be useful in scenarios where you would only like to visualize the records around a particular record or in a specific region, all while staying on the record form.
New Redesigned Drawing Toolbar
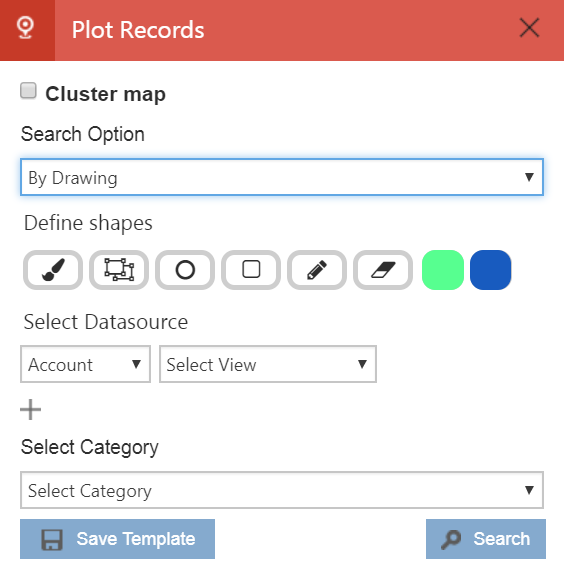
Drawing Tool in Maplytics has always been a powerful feature, and the ability to draw a shape on the map and search records within that shape can prove beneficial in multiple scenarios. With the upcoming Maplytics October release, we are enhancing and redesigning the Drawing Tool to provide more freedom and control to the users.
Now users will have the below Drawing Options available right on the Plot Card.
- Freehand drawing
- Polygon
- Circle
- Rectangle
- Edit
- Erase
- Fill color
- Stroke color
Shape Operations
Maplytics always supported drawing multiple shapes on the map but what if you wanted to perform binary operations on the shape like union or difference?
With the upcoming release, we are bringing the binary shape operations. Now the users can perform binary operations like Difference, Intersection, Union, Union Aggregate, and Disjunctive Union.
With the binary Shape Operations available, users can quickly perform drill-down analysis and get even more out of their Dynamics 365 data.
Apart from this, we are making a lot of UI and under the hood improvements in Maplytics.
Stay tuned for updates on the upcoming Maplytics October Release.
Meanwhile, start your free TRIAL today from our Website or Microsoft AppSource!

