With variety of features within Maplytics (Preferred App on Microsoft AppSource) that helps a user to drill down their Dynamics 365 CRM data, Maplytics also provides search options to plot data that is relevant to user’s interest for plotting. With such huge data in Dynamics 365 CRM, users can avoid plotting all of the data on map and can focus only on the required regions.
Earlier we saw how users can focus on the data within any area of interest even if it cannot be defined by a geographical boundary by using the search option of ‘By drawing’. With this option, user can draw a desired shape using the drawing tool and get all the data that belongs to that shape plotted on the map. Just like this, if the users need to work on the Dynamics 365 CRM data that belongs to a particular region on the map which can be defined by a geographical boundary, they can use the search option of ‘By region’.
Now, let’s explore more about the benefits of this search option.
Users can open the plot card within the Detail map in order to use the search option of ‘By region’.

After selecting this search option, users will get options to select a region type i.e. City, State, County, Country, PostalCode, PostalCode Sector, Postal Code(Outward Code), Postal Code Areas.

The user can also plot multiple regions under a particular region type. Given below are the definitions of some of the region types.
- Postal Code: The smallest postcode category, such as a zip code.
- Postal Code Sector: The second ‘1’ is called ‘Postcode Sector’. Example: CA1 1
- Postal Code(Outward Code): This is called Outward Code, the part of the postcode before the single space in the middle. Example: CA1
- Postal Code Areas: The next largest postcode category after Postcode1 that is created by aggregating Postcode1 areas.
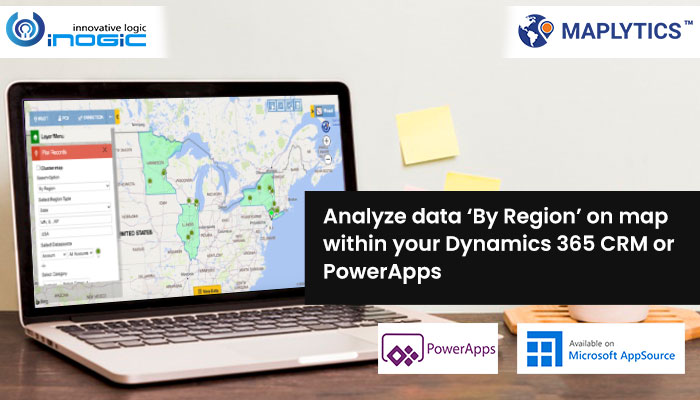
Users can select any one of the region types and enter the required names of the regions and other values in the provided fields and then select the required Datasource & view and click on Search. This will plot all of the records that belong to those specified regions only. For an instance, the below screenshot shows all of the accounts that belong to the states Minnesota, Illinois and New York within USA.

This way users can choose to view their Dynamics 365 CRM data that belongs to the regions that they are interested in analyzing. Similarly, users can use other search options as well i.e. By location, By drawing, By territory and By template in order to get the required search results on the map.
Browse thought our blog/video page to go through other amazing Maplytics features.
To get a free demonstration of Maplytics, please contact us at crm@inogic.com.
You can also mail us your mapping requirements to get a demonstration specific to your mapping requirements.
Happy Mapping and Stay Safe!


