Maplytics is a geo-analytical tool with integration between Bing maps and Dynamics 365 CRM. It is Certified for Microsoft Dynamics (CfMD) meeting the highest standard of Microsoft for Dynamics Partners. Maplytics is quite popular in the Dynamics 365 CRM community owing to our Partners, peers and Microsoft experts. As a token of gratitude, we keep revising its features to meet their expectations and be in alignment with the need of the hour.
It is a time of celebration for us, yes, March 2019 release has set another milestone in the journey of Maplytics! With March 2019 release we have made the visualization and analytical power of our end users quite a notch better. One of the major features introduced in this release is Census Data Visualization.
Census Data is the official data about a population or demography. It enables the officials to make informed decisions about a section of the population spread. With the analysis of Census Data, we can take strategic actions to empower the social structure of an economy. Therefore, we introduced Census Data Visualization in our current release to drive our end users to further optimize the usage of Maplytics in an extended manner. Maplytics enables visualizing data on map like Housing units, Area land, Area water, population demographics, and others.
United State collects Census Data every 10 years. Maplytics provides default data for three types of geographical boundaries of US i.e. States, Counties and 111 Congressional States. However, the users are not restricted to using US Census Data and they can bring their own data and save them as shapefiles. Users can create categories for the attributes and plot them on map for a more discrete visualization. Census Data can be plotted along with existing Overlay feature.
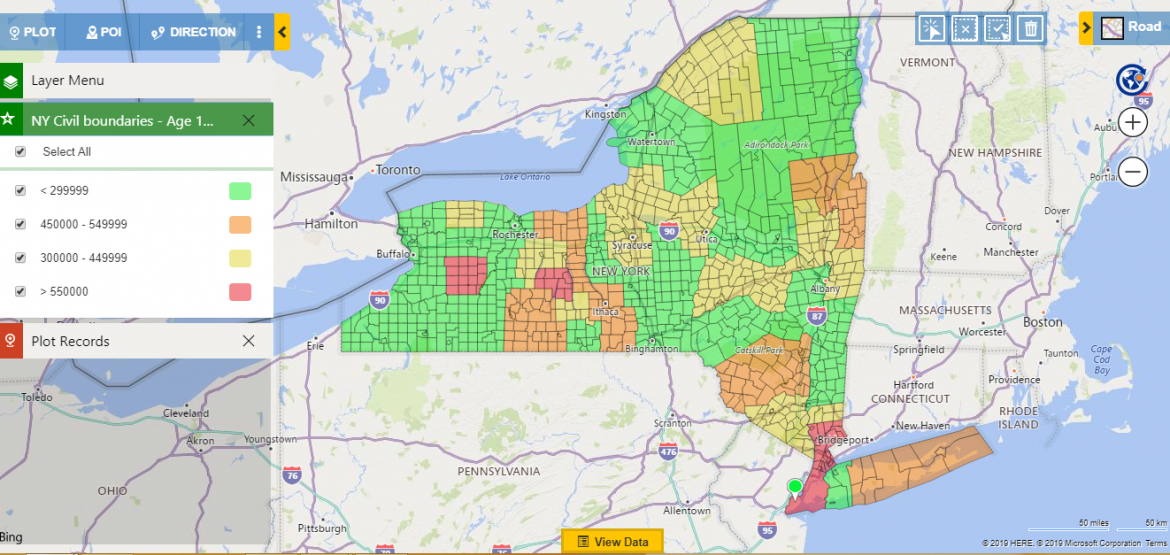
To understand Census Data Visualization better let’s consider a use case. Suppose as a publisher you want to launch a science fiction novel in New York State targeting age group 15-34. To achieve this, Census Data Visualization can play a crucial role. You can first visualize the data where you as a publisher can expand your business. This enables you to plan and plot your data by yourself thereby saving the cost of hiring a sales agency.
You can view the data spread between age 15 and 34 on the map. This gives you the density where there is high, low and average spread of population. You can analyze this data to plan launching your books in a particular area with high or average desired age range.
After you visualize your data on map the next step is to analyze in which locations you already have an active account or a franchise. For this you need to plot the active accounts on the map. You can target the areas that do not have a franchise to hire third-party organizers for exhibiting your book launch.
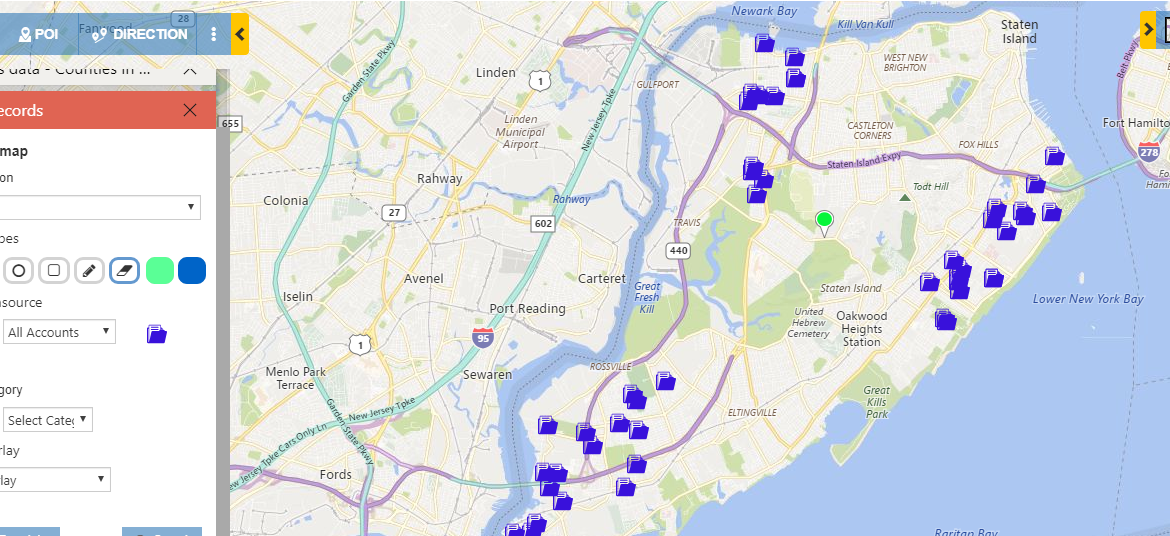
Thus by analyzing your data on map, you can easily plan your business and target the right age group. Third party organizers can help you in hosting a successful book launch without an additional cost of agency. Therefore, Census Data helps in managing your business in a very diverse manner and gives you deep insight into your data on multiple levels.
For exploring Census Data Visualization and our other features such as Support for CDS, Territory Management, Radius Search, Appointment Planner, Heat Maps and others download Maplytics solution from our Website or Microsoft AppSource.
We are eagerly waiting to hear from you. So, in case you have any queries, suggestions, feedback or want a demo, mail at crm@inogic.com
Till then Keep Mapping, Ciao!


