Maplytics has always been very efficient in terms of helping professionals to analyze data and take strategical decisions for their organizations globally. Within this procedure, to propose strategies professionals often need to submit a report on their analysis to their management. With Maplytics, along with analysis of Dynamics 365 CRM / Power Apps data, users can also create report for analysis done in order to be used as a base to take strategical decisions for the organisation.
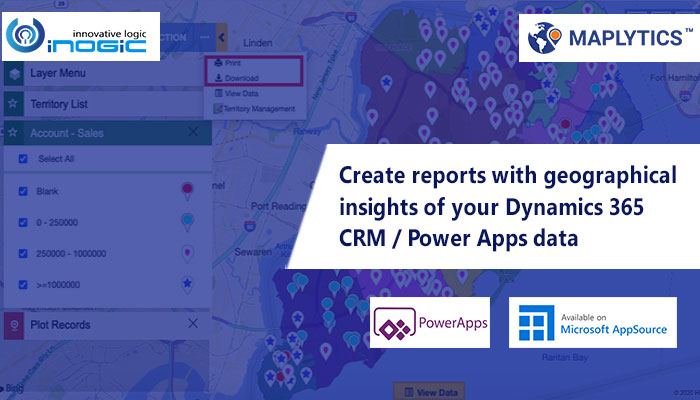
Angelina is the Sales manager in her company. She handles the sales team and manages to complete the sales target every year. In order to increase the sales, she needs to improve the processes in order to widen the coverage of market, handle prospects and customers better and thus enhance the sales productivity. To achieve this, she analyses the current scenario with the help of Maplytics. Now, she also needs to add this analysis report to the presentation prepared for the higher management. To ease this, Maplytics allows users to print and download the data that is plotted on the map. Angelina can easily plot her territories to view all the accounts categorised by sales to see the sales generated. She can now simply click on the three ellipses and use the option of print or download to get the map and add it into her presentation.

She can further plot the regions and the open cases categorized by owners in order to understand which region has more open cases and who is responsible for the respective cases. She can again print or download and add this in her report. Similarly, she can plot data with various other options as per her specific need and print or download it to add to her presentation.

She can also export the data plotted on the map to an excel file which will further help her to share the data to her management. For instance, she can plot all the accounts by region and categorize it by annual revenue to see which region is generating more revenue and then export the data to an excel file by selecting the option within Mass Actions. Thus, her management can also further filter data within the excel file, such as filtering accounts by region or annual revenue to analyze it more.

Start using Maplytics to create reports with geographical aspects of your Dynamics 365 CRM data.
You can explore the features of Maplytics in a free trial and evaluate it based on your mapping requirements.
Visit our website to download the Maplytics solution as per your CRM version now and follow read me file to activate a free trial.


