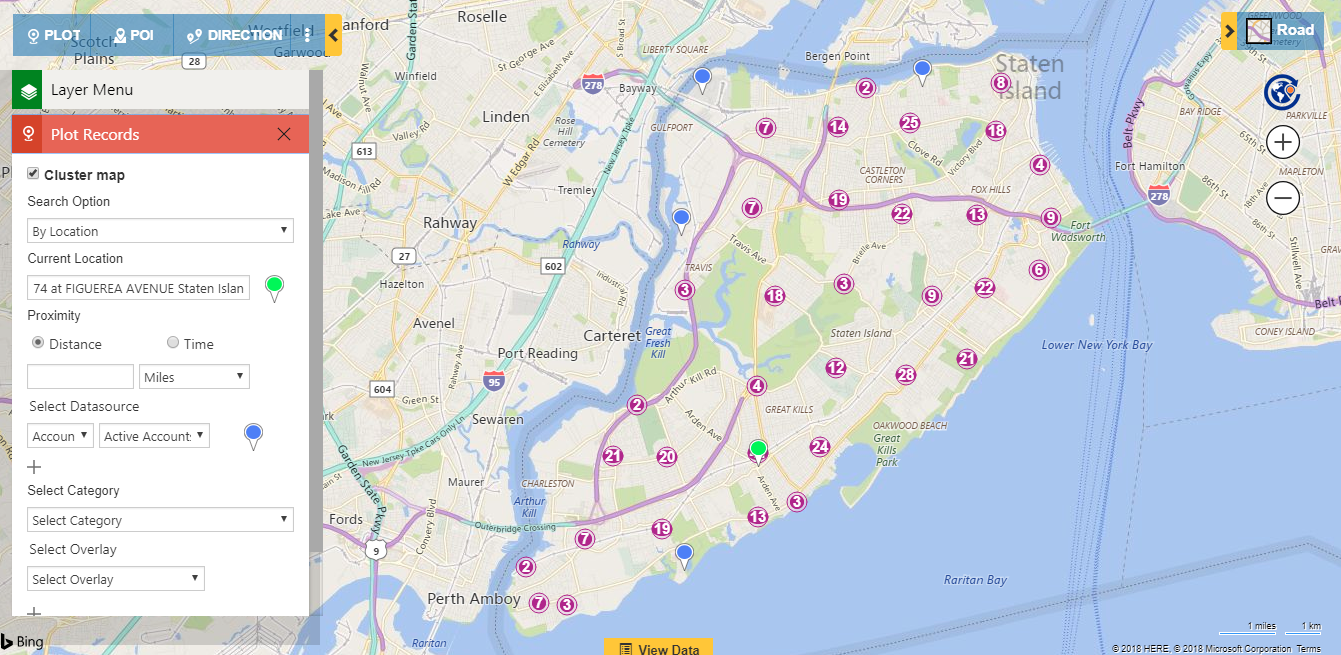
Map Clustering may be a small but most strategic feature of Maplytics. It enables user to view closely positioned pushpins into a cluster. When a user has many pushpins in same area, they start to overlap when user zooms out of map, and when they zoom in, they are able to see individual pushpins.
For instance, if a user has two records with the same address (same latitude and longitude), then they will see two overlapped pushpin one on another which will resemble to one pushpin but if they use cluster map it will show them as two.
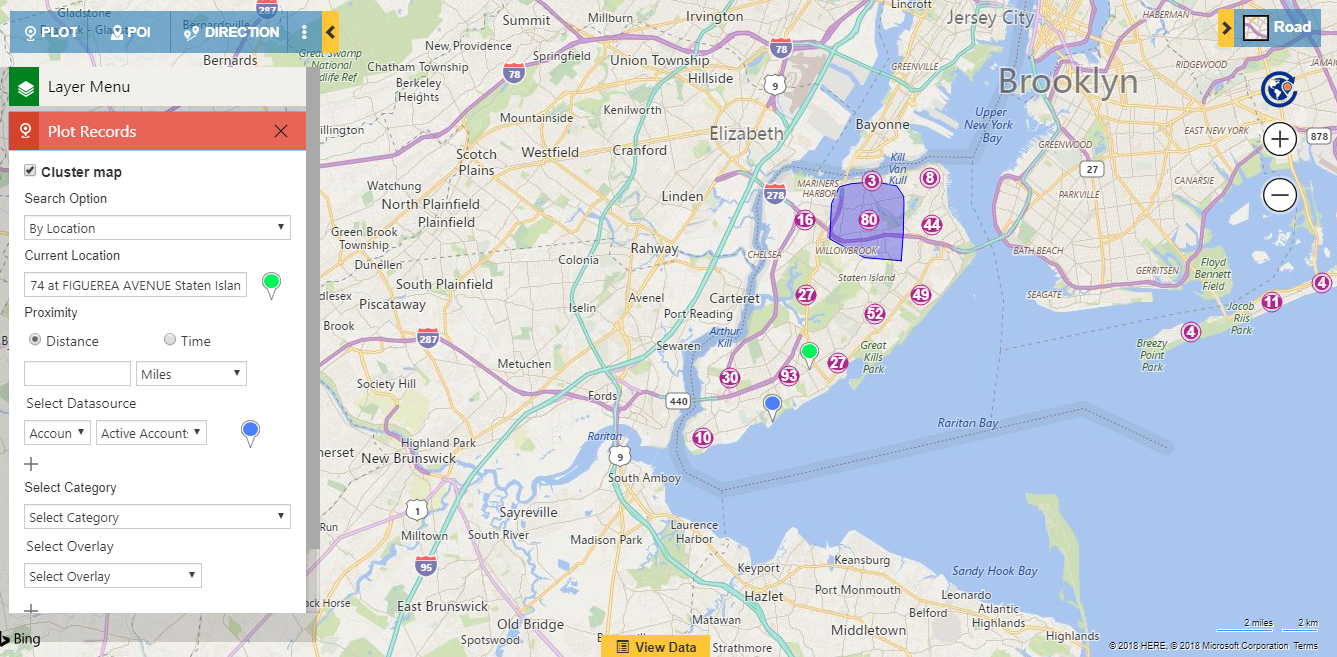
With Maplytics October 2018 release we have added two new enhancements to cluster map which will help user for a better drill-down analysis.
Cluster Area
The user can now hover on any cluster to see the ‘Cluster area’ which shows the data spread. The data spread is based on the area covered by the pushpins existing in the cluster.
Spider cluster
The user can click on any cluster to view the pushpins existing in the form of a ‘Spider cluster’.
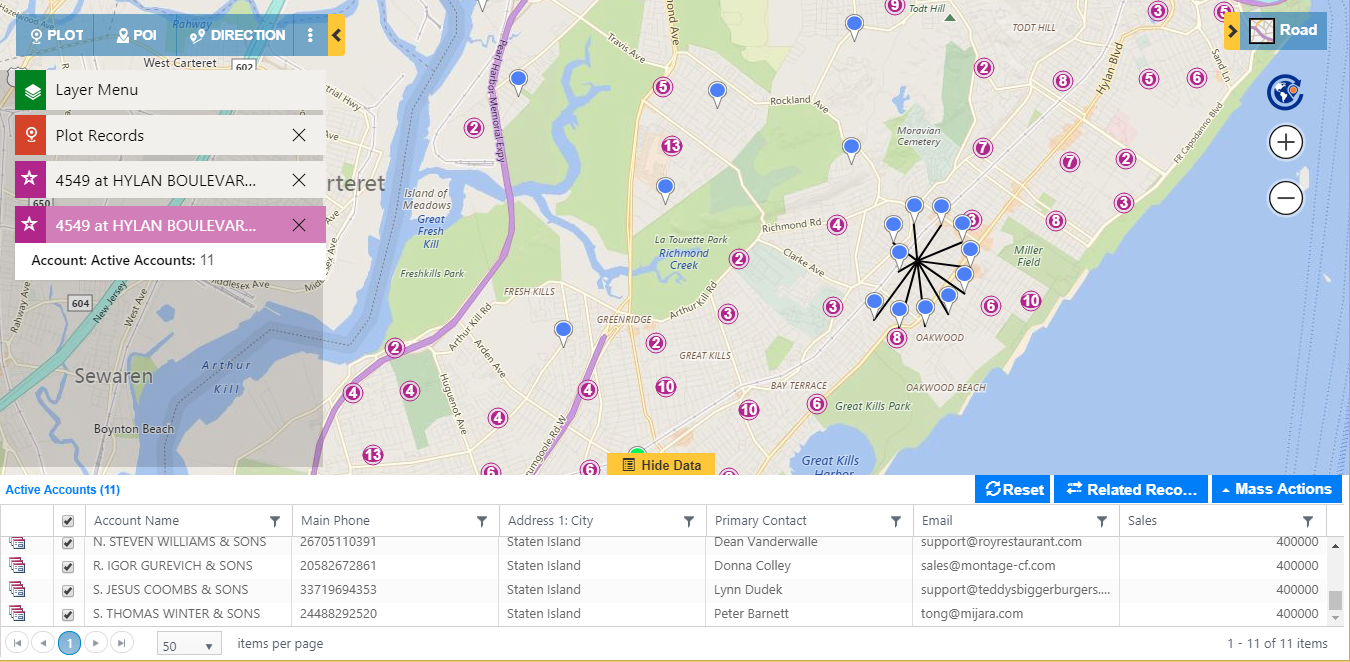
Note: A cluster should have a maximum of 20 pushpins, in order to show a Spider cluster
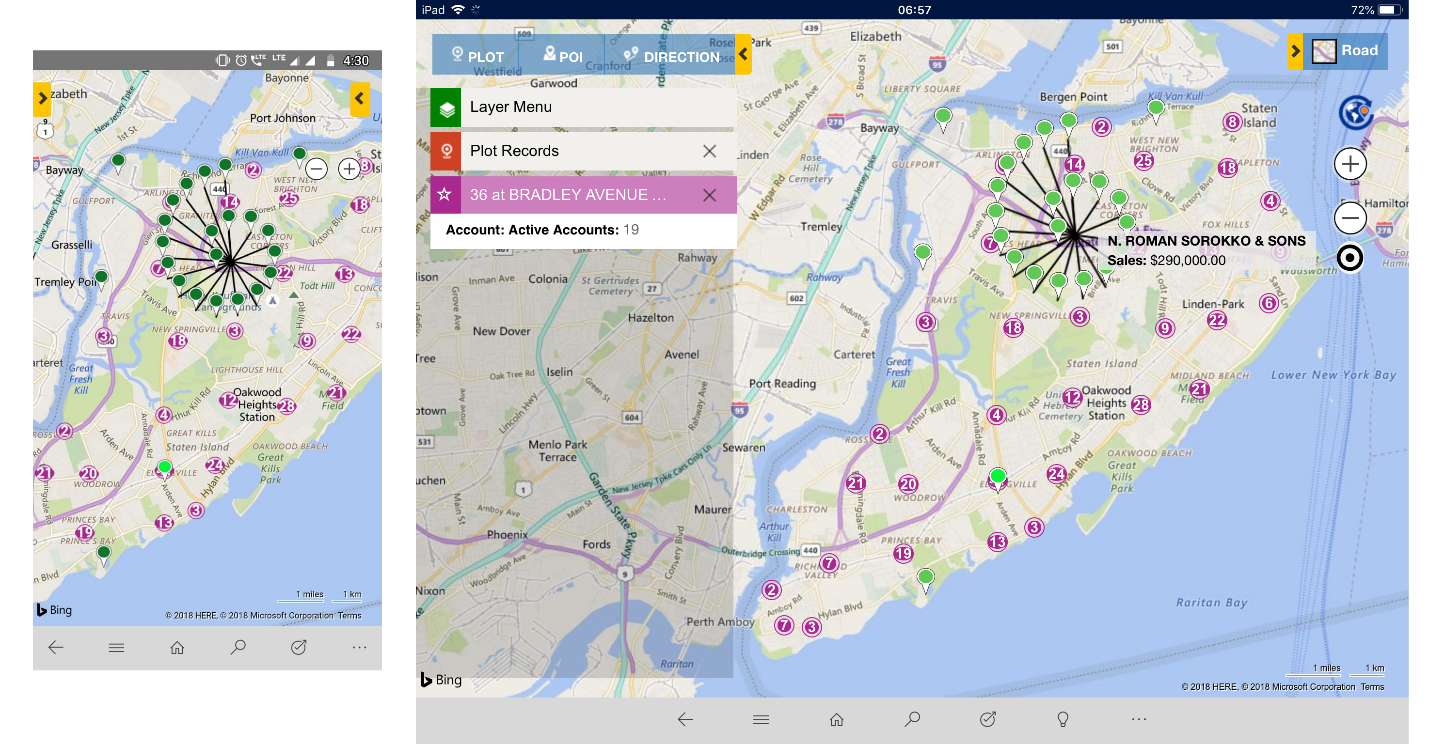
Cluster Map on Dynamics 365 App for Phones & Tablets:
User can also use cluster map feature on the go using Dynamics 365 App for Phones & Tablets giving more meaning to their Dynamics 365 data visualization.
Get your FREE TRIAL today!
Happy Mapping!