In today’s digital economy, data drives business!
Organizations around the world use Microsoft Dynamics CRM to organize and analyze their enterprise data. They further extend the functionalities of CRM by using geo-analytical mapping solution like Maplytics that runs natively within Dynamics 365 and simplify the process of analyzing big data to extract critical business insights.
One of the most preferred ways of analyzing Dynamics CRM data is through Heat Map Visualizations!
Why is Heat Map Visualization essential?
Mapping solutions empower users to create data-rich interactive maps. However, analyzing the massive volume of data points on a map can be a daunting task.
That is when Heat Map Visualizations comes into the picture!
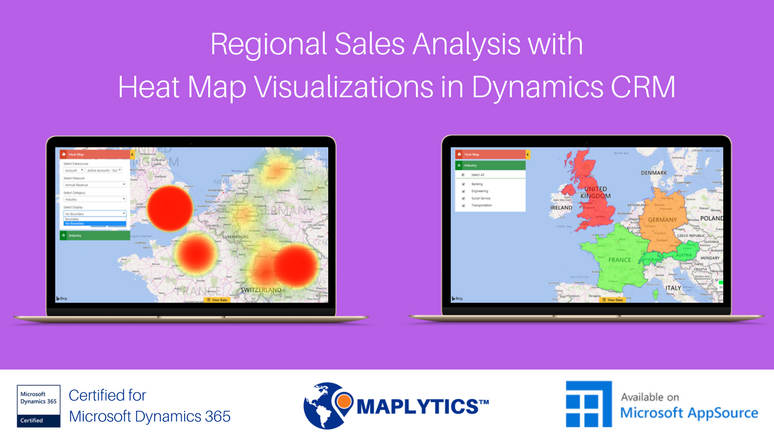
Heat Map is one of the most effective data analytics tool available in Maplytics. Maplytics summarizes Dynamics CRM data and creates insightful geographical Heat Map visualizations for quickly performing regional sales analysis.
Performing regional sales analysis using Heat Map visualizations within Dynamics CRM
The seamless integration between Bing Maps and Dynamics CRM allow the Sales Managers to create Heat Map visualizations and further filter & segment data for drill-down regional sales analysis.
With Maplytics within Dynamics CRM, the Sales Manager can easily create heat maps right within Dynamics CRM.
The Sales Managers can create a No Boundary heat map visualization to reveal the customer densities based on annual revenue without geographical boundaries.
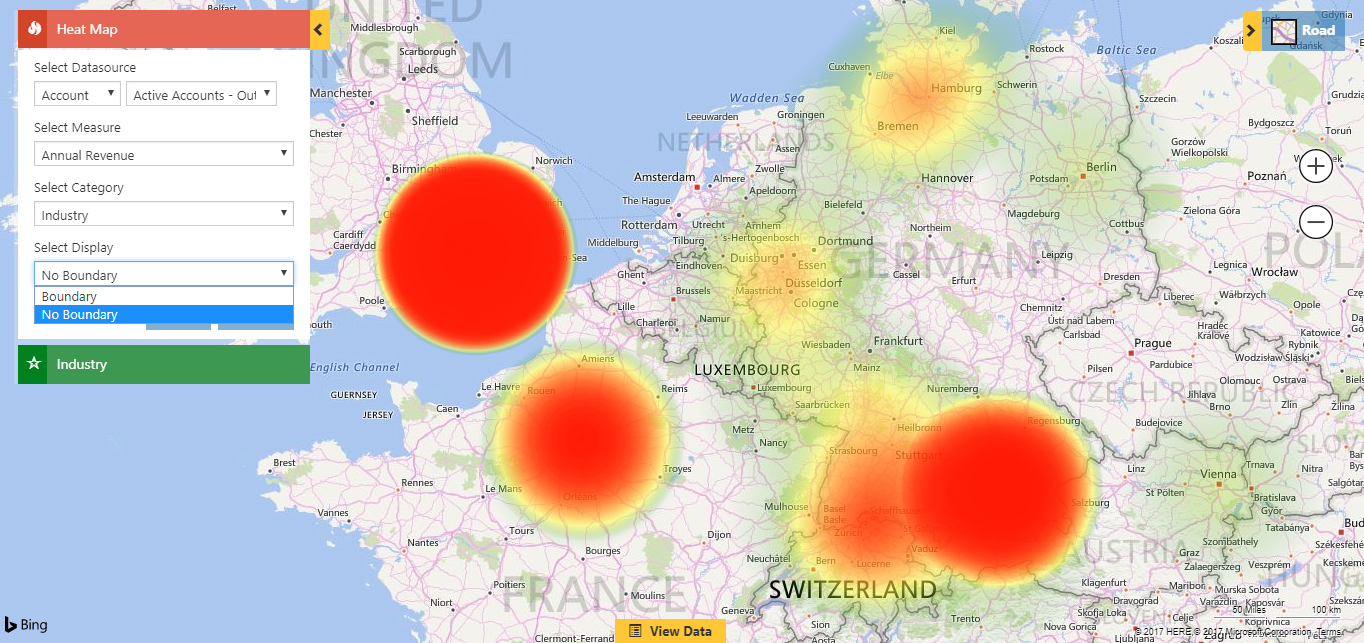
This gives the Sales Managers an overview of the density of customers based on annual revenue covering the whole geographical spread.
Sales Managers can then select the Boundary heat map visualization and further filter and segment the Dynamics CRM data to perform drill-down regional sales analysis.
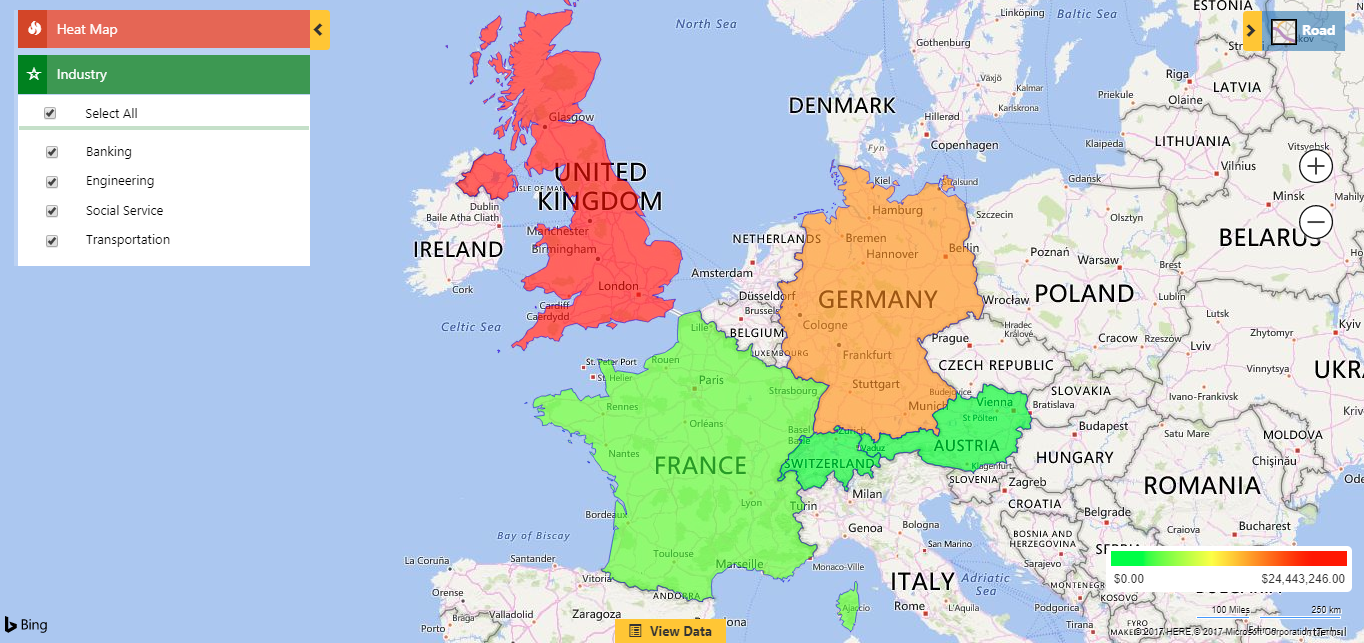
Heat Map visualizations take out the guesswork from the decision-making process. Sales Managers can use heat map visualizations within Dynamics CRM to understand the geographical sales performance, identify the weak performing regions and take necessary steps to improve the overall sales of the organization.
Maplytics is one of the leading Certified for Microsoft Dynamics 365 (CfMD) geo-analytical mapping app that empowers businesses to visualize their Dynamics CRM data on a map and perform an in-depth geographical analysis. Apart from Heat Map Visualizations, Maplytics offers compelling features like Route Optimization, Appointment Planning, Sales Territory Management, Radius Search, Point of Interest Search to allow organizations to close more deals, improve their business processes and enhance customer engagement.
Get started with Maplytics. Download your free trial from our Website or Microsoft AppSource.
Happy Mapping!