Businesses thrive when they understand their markets well. This is why most businesses today invest in large customer data handling software like Dynamics 365 CRM / PowerApps. It consolidates their data and unlocks the potential of extracting valuable insights. Maplytics (Preferred App on Microsoft AppSource) uses its smart features to transform this potential data into actionable insights.
While analyzing the market for any product, one of the main factors that are considered is the census data -population of the targeted region, count of people belonging to a certain age group, income bracket, contract time remaining, etc. are all demographic information about the people living in a region that helps an organization understand the market and determine their target audience for their products or services. Based on the analysis, organizations further conduct surveys according to the demographics of the respective region to drill down the information on people’s expenditure habits, decision-making process, and interests in the products/services.
To help our users with the census information, Maplytics provides some census files by defaults that are available after configuring Maplytics into CRM. Users can plot these census data on the map using the feature Overlay and can also configure them as per their requirements to visualize the regions categorized based on the required attributes like population, area, water, etc. Users can also have their own census data saved in CRM and plot the same on the map.
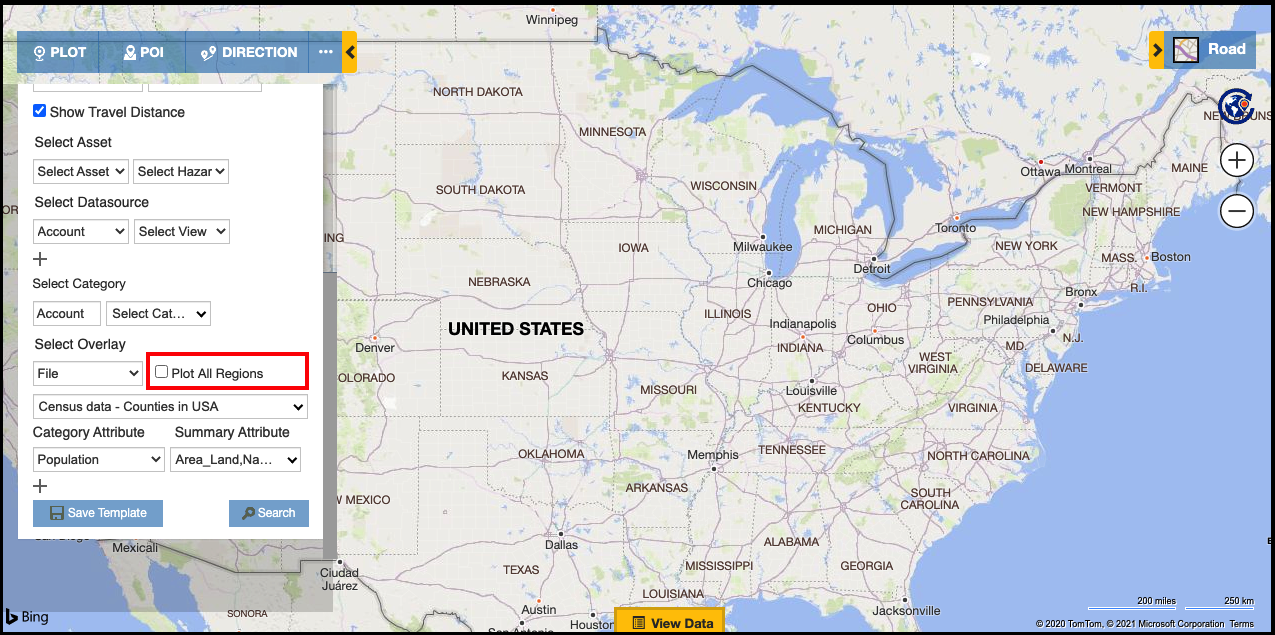
While using a census file that contains census data for a huge regions of the country, users can also choose to focus on only the required regions at a time using the feature of ‘Show region’. While using the feature of ‘Overlay’ to plot a census file, the user has the option to plot all the regions by default or plot the regions as and when required. So, while plotting a census file, the user can simple deselect the option of ‘Plot all regions’ on the Plot card.
Further, the user can select the ‘Category Attribute’ to categorize the regions plotted by file and the ‘Summary Attributes’ to show the same in the Summary card when clicked on any region. If user has already selected the attributes within the ‘Configuration’ of the census file in the Territory Entity, then it will be selected by default, however, user can also deselect them in the Plot card and can select other attributes and click on ‘Search’. This will plot the selected census file in the background and as the option of ‘Plot all regions’ is deselected, the regions will not be visible on the map by default, which enables the user to focus on only the required regions by using the feature of ‘Show region’.
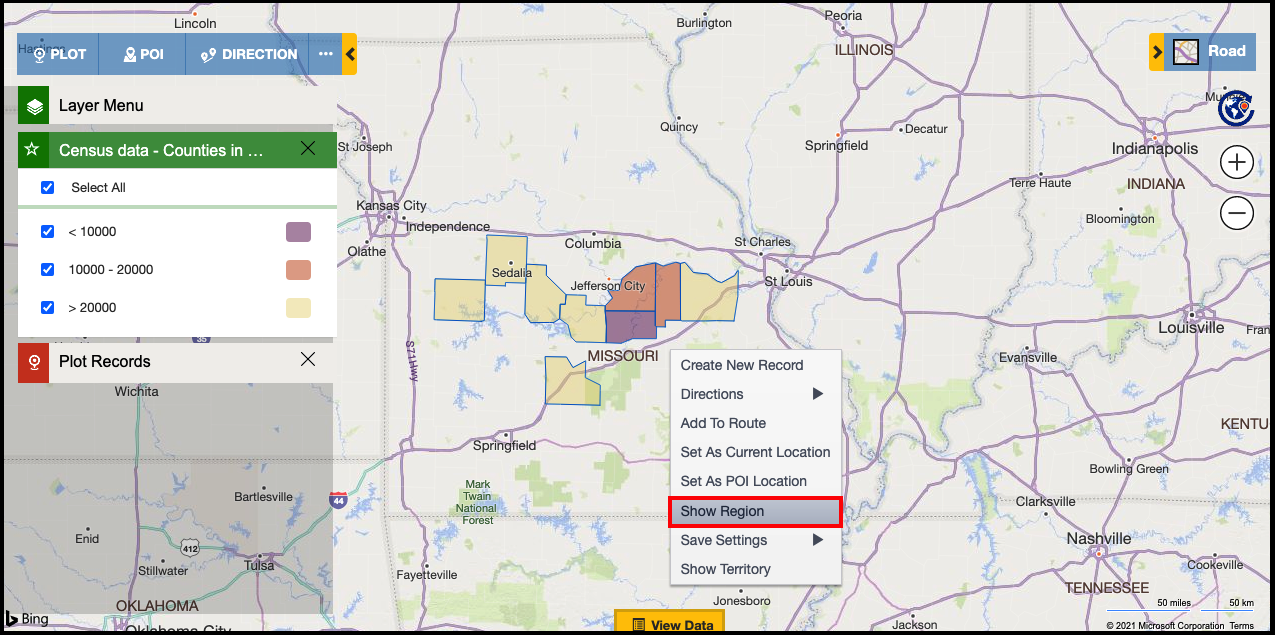
Once the user has plotted the census file on the map in the background as explained above, they can zoom into the area they want to focus at and right-click on the same to open the ‘Contextual menu’. Within this menu, the user can click on the option of ‘Show region’ to view the respective region from the census file on the map. As per the attributes selected, the shown regions will follow it and will be visible in the respective colors as well.
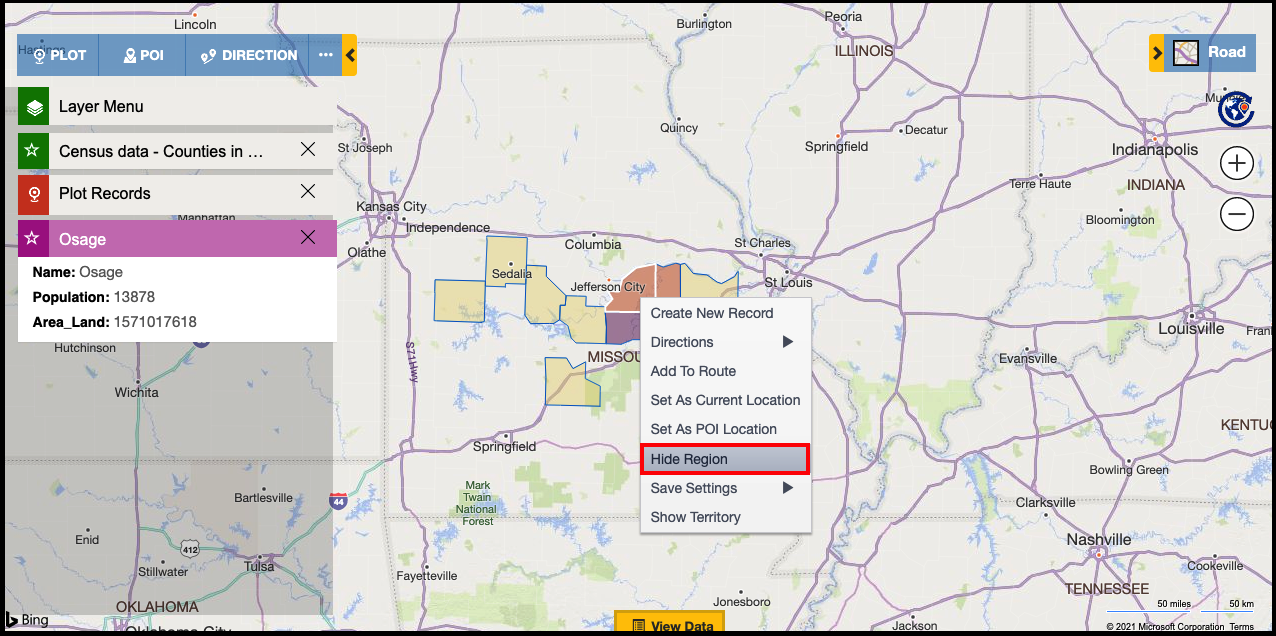
This will help the user to view the census data for regions they want to focus at instead of viewing all the regions at once. They can further click on any region to view the summary card that shows the respective summary attributes that were selected while plotting the file using Overlay. This way user will be able to visualize and understand the demographics for the required region on the map. The user also has the flexibility to hide the regions that they do not want to see. To do so, they can right-click on the required region and select the option of ‘Hide Region’ from the Contextual menu to hide the respective region.
Thus, users can work on their region of interest and analyze the market using the census data files that Maplytics provides by default or their own census files to view the demographic information they need to determine the target audience for their products/services. Explore more about analysis with Overlay and census data with a free trial of your Preferred Maps Integration app within Dynamics 365 CRM / PowerApps now.


